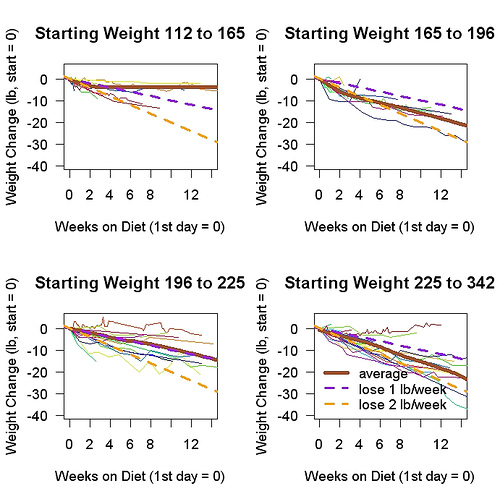
The most basic question about the Shangri-La Diet is how well it works. As the host of The Amazing Race might say, there are many ways to answer this question, each with their own pros and cons. Thanks to Rey Arbolay, we can answer this question in a new way: by looking at the data in the Post Your Tracking Data Here section of the Shangri-La Diet forums, where more than 80 people have posted.
The goal of SLD, of course, is weight loss. The problem with just plotting pounds lost as a function of time on SLD is that a loss of 10 pounds is quite different to someone who starts at 120 pounds and someone who starts at 300 pounds. To deal with this I have divided the results by starting weight. In the graphs below, the ranges of weights were chosen so that there would be roughly the same number of people in each graph.
Starting weight makes a big difference — at least, between the two extremes. Many of the people who aren’t losing very fast are in the lowest quartile. There are still a few outliers — people at the higher starting weights who are losing slowly if at all — but not many.
The next step is to do an analysis that estimates the effect of starting weight and somehow removes it. It might be better to divide people by BMI rather than starting weight, and maybe the y axis can be improved.
Before we take out the arsenal of regressions
Are the people who lost a lot of weight more likely to post about it?
Are the people who lost a lot of weight more likely to post about it? Well, no, that is not a problem because it is a prospective study — people post their weights as they go along. The better question is: are people who are going to lose a lot of weight more likely to post about it?