The number of visitors to the Shangri-La Diet forums has been growing. This graph shows, for each day, the maximum number of people accessing the forums at one time. (When you load a page, I guess you are considered “at” the forums for some length of time.)

“Most online” has steadily increased since January. These values are closely correlated with the number of visitors in a day, for which I have less data.
Here is another way to look at the most-online data. Each most-online value is divided by the value from one week earlier.
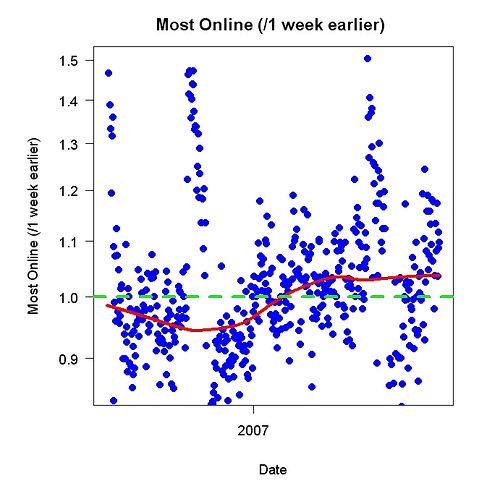
Perhaps the rate of increase is increasing but it isn’t clear.
Yay!