From my omega-3 results I got the idea that our brains may work better or worse without our noticing. I want to track how well my brain works not only to test the effects of different dietary fats (our brain is more than half fat) but also to allow the possibility of discovering new effects, both good and bad.
One test I am using is a typing test (early results here). Another is an arithmetic test. I got the idea of using arithmetic from Tim Lundeen. Like him, I found that the speed with which I could do simple arithmetic problems (8+0, 4*3) was sensitive to the amount of omega-3 in my diet.
The arithmetic test involves doing 100 problems separated into 5 blocks of 20 each. There is little time between each problem. I type the last digit in the answer; e.g., if I see 8*8 I type 4. The possible answers are 1, 2, 3, 4, 7, 8, 9, and 0 so that I don’t have to move my fingers off the keys. There is feedback after each block. I aim for 95% correct.
This is my second use of an arithmetic test. The advantages of this one compared to several other tasks I have tried are:
- Portable. Only requires a laptop.
- Well-learned. So I should plateau (reach a steady speed) sooner than with a task I learn from scratch. When my speed is steady it will be easier to compare different conditions — no need to correct for learning.
- Uses eight fingers. Many tasks used by experimental psychologists have just two possible answers (yes/no). With eight possible answers there is less anticipation and less worry about repetitive strain injury.
- No data entry. The task is written in R, the language I use to analyze the data.
- Many measurements per minute. This allows me to correct for problem difficulty and get a standard error for each test session.
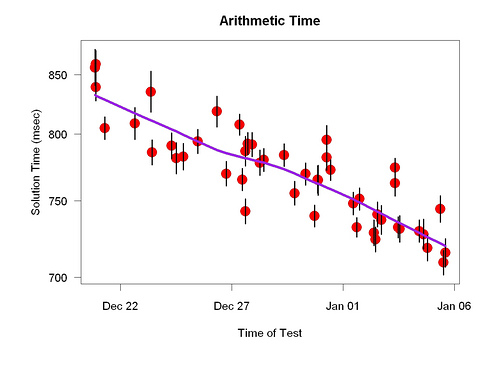
Here are early results.

In the test sessions after January 1, two sets of points are above the line — I was slower than expected, in other words. Both came from test sessions about an hour or so after I woke up. At the time of those sessions I felt fine — not tired, not groggy — and was a little surprised. This is a trivial example of what I am looking for: new environmental effects.
The bigger context of this research is that scientists know a lot about idea testing but almost nothing about idea generation — how to find new ideas worth testing. Maybe this research will teach me something about idea generation.
A talk by Tim Lundeen about related stuff.
nice work seth. very interesting. what statistics packages do u prefer? i use excel, word, spss and a few online calculators.. also, have u ever used qualitative methods for self experimentation?
The statistics package I use is R. It is open source. I’m not sure what qualitative methods are but almost all of my self-experimentation has involved numerical measurement so I guess the answer is no.
Would you mind posting your R code for the arithmetic task, Seth? It would be particularly interesting to see how you record reaction times in R. Is there a built-in function that provides ms accurate timing?
Joe, it would be difficult to post the R code. There are 20-30 functions involved. I measure reaction times using Sys.time, which provides accuracy to about 1/60th of a second. Since there are about 100 measurements per session, that provides plenty of accuracy. I use getGraphicsEvent to detect a keystroke. Unfortunately getGraphicsEvent only works with Windows. If you have other questions I am happy to answer them.
If you know how to use R, have a Windows computer, and promise to run yourself for several days, I will send you the R workspace. But there is nothing very interesting about the code, apart from what I just said.
Unfortunately, I use R on OSX. R in OSX does include getGraphicsEvent, but you’re right that it doesn’t appear to work. The example code in ?getGraphicsEvent throws up an X11 error.
Anyhow, thanks for the offer to send the code, and for the info on how you collect RTs with R.