Liberation Therapy: Contradictory Evidence

As you may know, an Italian surgeon named Paolo Zamboni has proposed that multiple sclerosis (MS) is often due to poor blood drainage from the brain. Improving drainage, he and his colleagues found, reduced MS symptoms. The surgery is called liberation therapy. From this article (thanks, SB) I learned of evidence contradicting Zamboni’s findings:

The studies were independently conducted case–control experiments designed to determine whether abnormal outflow of blood in the head and neck is actually a defining feature of MS. Two of the studies appeared to confirm Zamboni’s observations; the pooled results identified 31 cases of CCSVI out of 35 MS patients and none in 45 matched controls. Yet three other studies, from Germany, Sweden and Holland, with a pooled set of 97 MS patients and 60 matched controls, found no significant evidence of a difference in blood flow between those with MS and those without. In fact, when Doepp et al. attempted to replicate the Zamboni trial they did not find a single case of CCSVI in either the 56 MS patients or the 20 controls examined.

Wow. What intense disagreement. The failure-to-replicate studies used different ways of measuring blood flow so the disagreement is less stark than it appears from this description. But it is still remarkable.

This is highly newsworthy. I can’t think of another case where two different labs have gotten such different results. Unfortunately the article is appalling in its one-sidedness (e.g., liberation therapy is said to have “known risks, unknown benefits”).

Meat Consumption and Weight Gain: Health Journalism Done Right

This article by Eoin O’Connell reports a study in the American Journal of Clinical Nutrition (the top nutrition journal) that found a correlation between meat consumption and weight gain: The more meat you ate, the more weight you gained over five years. Meat is fattening! reported several newspapers.

Mr. O’Connell did something unusual for a health journalist: He thought for himself. I don’t mean he applied a formulaic criticism (e.g., “correlation does not equal causation”). That’s not thinking, that’s knee-jerking. Mr. O’Connell read the paper. And he noticed an interaction: The correlation between meat consumption and weight gain depended on activity level. The study involved about 400,000 people. The researchers put each person in one of four activity levels: inactive, moderately inactive, moderately active, and active. There was a correlation between red-meat consumption and weight only for the two most active groups (moderately active and active). The original article reported that this interaction was significant:

The relation between red meat and weight gain was also stronger in physically active subjects compared with moderately inactive or inactive subjects (P values for interaction = 0.02)

The obvious implication of this interaction, as Mr. O’Connell says, is that meat caused muscle gain. Weight differences between more-meat and less-meat eaters were due to differences in muscle mass. This puts an entirely different spin on the results. The alternative explanation is quite plausible. I once had a grad student who was a vegetarian. When he was an undergrad, he told me, he and his roommate would go to the weight room and do similar sets. His roommate, who ate meat, rapidly gained muscle; he did not. Of course, meat = animal muscle.

Mr. O’Connell continued to the really interesting part of his article:

Perhaps not so surprisingly, the consideration that muscle is a form of weight gain does not appear in the newspaper articles but much more surprising is the fact that it does not appear in the original journal article either.

The AJCN article has fifty authors. Not one of them, apparently, noticed this all-important point! Nor did the reviewers for this prestigious journal. The article concludes: “Our results are therefore in favor of the public health recommendation to decrease meat consumption for health improvement.” No, they’re not, if the more meat, more muscle explanation is correct.

Most prestigious journal. Fifty authors. Huge expense. Total F-up in the sense that the final conclusion is probably wrong. (To be fair, the paper has plenty of value in other ways.) Congratulations, Mr. O’Connell, for noticing.

Sterilities of Scale and What They Say About Economics

You have surely heard the phrase economies of scale — meaning that when you make many copies of something each instance costs less than when you make only a few copies. Large companies are said to benefit from “economies of scale” — so there is pressure to become bigger. Every introductory economics textbook says something like this.

Here’s what none of them say: The more of Item X made by one company, the more “sterile” Item X becomes, meaning the less Item X is able to spark innovation. Call this sterilities of scale. You have never heard this phrase — I invented it. (I cannot find it anywhere on the Web.) But it is just as obviously true as the notion that when you make more of something you can make each one more cheaply. If 100 widgets are made by one company, there is going to be less innovation surrounding widgets than if 100 widgets are made by 10 different companies. Sterility of Scale 1: When ten different companies make something, more people are studying and thinking about and pursuing different ways of making it than if only one company makes it. Sterility of Scale 2: The more profitable a single item becomes (due to low cost of manufacture), the more pressure not to change anything — not to kill the goose that lays golden eggs. Sterility of Scale 3: The larger the company, the more employees who care only about preservation of their fiefdom (comparing 10 companies of 10 people each to 1 company of 100 people). See how obvious it is that sterilities of scale exist?

The two concepts — economies of scale and sterilities of scale — are equally elementary. But only one is taught. Study of innovation should be 50% of economics but in fact is close to 0%.

This is why Tyler Cowen’s The Great Stagnation is so important — because it begins to point to this great gap. Jane Jacobs did so, but had little or no impact. (At a Reed Alumni Gathering I was seated next to a professor of economics. “What do you think of the work of Jane Jacobs?” I asked her. “Who’s Jane Jacobs?” she replied.) I think human decorative preferences are so diverse (chacun a son gout, no accounting for taste) for exactly this reason, to avoid sterilities of scale. Diversity of preference makes it easier for many different manufacturers to thrive, which increases innovation. For example, diversity of furniture preference makes it easier for dozens of furniture companies to survive, thus increasing innovation surrounding furniture. Clayton Christensen’s The Innovator’s Dilemma describes many examples where large companies were much less innovative than smaller companies — so much so they often went bankrupt. Which suggests sterilities of scale can be fatal.

If there were more understanding that ten small things are going to be more innovative than one big thing, I like to think that scientists would better understand the value of very small research and grant sizes would go down. An illustration of the general cluelessness is someone who wrote to Andrew Gelman complaining that a sample size was only 30.

I started thinking about this after hearing Nassim Taleb discuss economies of scale (e.g., here).


Nine Years of Weights, More Shangri-La Success

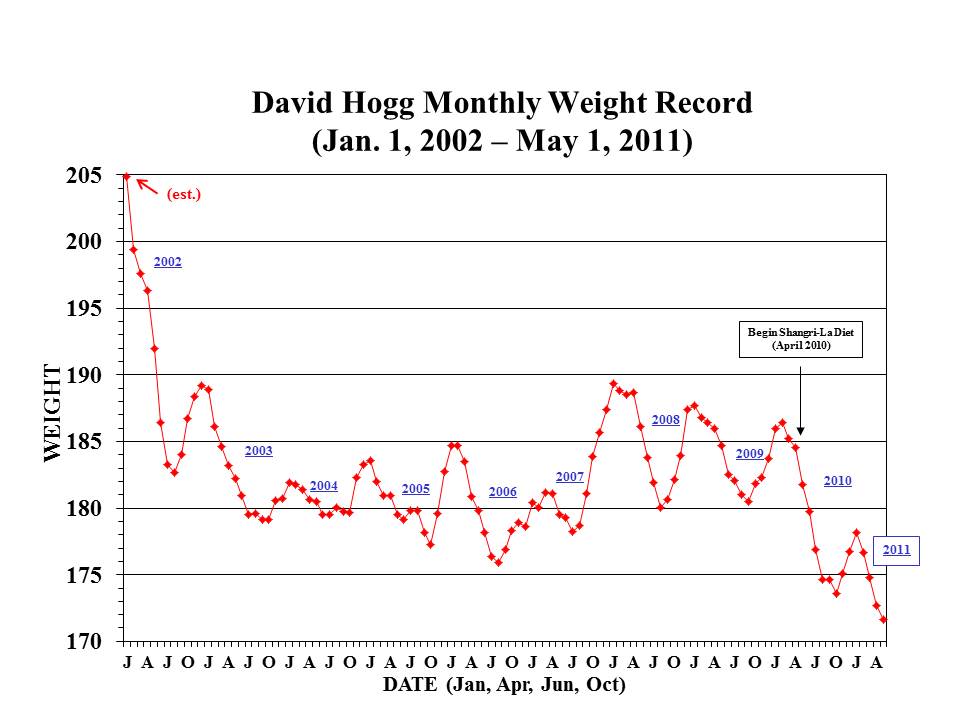
Seeing Alex Chernavsky’s ten years of weights inspired David Hogg, a professor of entomology at the University of Wisconsin, to send me his weight data for the past nine years — see above. Like Alex, he found that the Shangri-La Diet worked where other methods failed.

He is 5′ 10″ and 63 years old. When his weight reached 205 pounds (in 2002) he decided to take serious action. He began by increasing how much exercise he did, to “watch what [he] ate,” and to take “diet” pills. I asked him about the diet pills. He replied:

On [the advice of a local supplement store owner] I began to take L-Carnitine, which has a variety of effects (including some evidence for weight loss?), and an ephedrine based diet supplement (I don’t recall the name of the product). I took the ephedrine until its sale was outlawed (2006?), after which I started taking a NOW Foods product called Diet Support, which lists as major ingredients iodine, chromium, forskolin (from Coleus root), L-Carnitine, extract of Garcinia cambogia, green tea extract, and extract of Uva ursi leaf.

He described “watching what [he] ate” like this:

I started having a fruit smoothy with protein powder and flaxseed oil for breakfast (rather than eggs/cereal and toast) and I cut back from a full sandwich and fruit to a half sandwich and fruit for lunch. I did not modify what I ate for dinner but did attempt to eat less, and I tried to not snack between meals. I think all of this was somewhat successful, although I was hungry a lot and suffered regular setbacks.

He described his exercise like this:

My goal was to get some form of exercise daily. In reality I probably get exercise on average 5 days a week, but this was not too different than what I was doing previously. My primary means of exercise are bicycling and racquetball/squash, but I also golf (walking, not cart) and take a range of classes at a local health club that includes Pilates, spinning, and weight lifting.

In 2002 he increased how much exercise he did.

In 2002, in other words, he began to do conventional weight-loss things (eat right, eat less, and exercise more) plus take diet pills. This lowered his weight from 205 to 180 but not further, even though continued for years. So far the Shangri-La Diet has lowered his weight about 10 pounds. He does it like this:

I started out with sucrose water, after several weeks switched to ELOO (which did not seem to work for me, perhaps because it reminded me of popcorn?), quickly switched to fructose water, which I used exclusively for 6+ months, then switched again to walnut oil (the fructose water made me feel bloated). For the past approximately 4 months I have added fructose to the walnut oil, which I started to use up the large supply of fructose I ordered, but it actually seems to work the best of anything I’ve tried to date. I drink 2 tablespoons of walnut oil containing about a quarter of a tablespoon of fructose, twice daily.

My ideas about dietary control of the set point made a lot of sense to him.

At one time I believed weight gain or loss was purely a matter of calories in vs. calories burned. Up to age 30 that model seemed to explain my weight. After 30 it was not so simple, with my weight seemingly resistant to sustained loss or (in the short term) gain, and this led me to adopt the view that my weight was governed by an equilibrium or set point. This was easy for me conceptually. My professional interest at the time was insect population dynamics, and the prevailing view was that although insect population densities fluctuate (sometimes widely) through time, for a given species the fluctuations tend to occur around an equilibrium that is enforced through density dependent processes. However, I viewed my set point weight as “fixed”, so my paradigm did not explain the upward drift in set point and weight. Your discussion of this, from an evolutionary perspective, made me rethink my idea of a fixed set point and provided the perfect explanation for the upward drift in my weight (plus the way to convince the brain to decrease one’s set point).

His data are an important advance in understanding. They cover a long period of time and allow comparison of the Shangri-La Diet to three popular weight-loss methods: “controlling what you eat”, exercise, and various supplements (“diet pills”). No conventional weight-loss experiment covers as long a period of time.

Tucker Max on Paleo: “I Started Feeling So Much Better”

In this interview, Tucker Max talks about eating paleo.

Once I started doing this, I started feeling so much better. My brain felt like it worked better. Everything about me improved. So I kinda went down the rabbit hole, and I started reading up on diet and nutrition from alternate sources. Art De Vany, Robb Wolf, and Loren Cordain, they didn’t invent it but they kinda popularized the concept of paleo eating. I realized that if you’re just a normal person, and you have the normal ideas about diet and nutrition, everything you know is wrong.

If you ask me, Tucker’s enthusiasm/support for paleo is huge. Max Planck said progress happens funeral by funeral. I say it happens keg party by keg party — college students, more than anyone else, have open minds. A friend told me that when she was a freshman in college, her sociology professor criticized the textbook. Whoa! she thought. Textbooks can be criticized!? She had thought they were beyond criticism. As far as I can tell, American college students respect Tucker more than they respect anyone else. (My Tsinghua students may favor Nassim Taleb.) For example, this recent tweet: “ TuckerMax is my idol. and he’s on this paleodiet…so i think im going to do it too.” I found no tweets about the dietary influence of Michelle Obama (“ coolest First Lady ever“).

In spite of what the interview was shortened to say, Tucker got the idea of eating flaxseed oil from this blog, especially Tyler Cowen’s experience. He wrote to me about it at the time. I posted his comments about dental health (here and here) and sports injuries (here, here and here) under the name Anonymous.

I am pleased to announce that Tucker will be talking at the upcoming Ancestral Health Symposium at UCLA. The title of his talk is::

From Cave to Cage: Mixed Martial Arts in Ancestral Health

Sorry Tucker Max fans, symposium tickets are sold out. But after the conference you will be able to see the talk on the website.

Tucker’s latest book is Assholes Finish First.


Insider/Outsiders, Chinese History, and the Shangri-La Diet

Darwin was an insider/outsider; so was Mendel. Insider/outsiders are close enough to their subject to have a good understanding and skills yet far enough away to have freedom. In the case of Chinese history, a journalist named Yang Jisheng has filled that role. He wrote a book called Tombstone (Mubei) about the Great Famine (1958-61). He was able to write what professional historians could not:

Why are you the first Chinese historian to tackle this subject seriously?

Traditional historians [i.e., college professors] face restrictions. First of all, they censor themselves. Their thoughts limit them. They don’t even dare to write the facts, don’t dare to speak up about it, don’t dare to touch it. And even if they wrote it, they can’t publish it. And if they publish, they will face censure. So mainstream scholars face those restrictions.

But there are many unofficial historians like me. Many people are writing their own memoirs about being labeled “Rightists” or “counter-revolutionaries.” There is an author in Anhui province who has described how his family starved to death. There are many authors who have written about how their families starved.

“If they publish, they will face censure.” With respect to weight control, I am an insider/outsider. When I published The Shangri-La Diet, I did not expect censure. My colleagues (other psychology department faculty) wouldn’t care what I wrote about a different subject. To my surprise, I was censured — maybe a better word is denounced — by a nutrition education lecturer in the UC Berkeley Nutrition Department. The woman who denounced me had not seen my book. Based on what a reporter told her, she expressed her opinion of it in an email she sent to twenty people in her department and the chairman of my department. It said, in part:

I did give the SF Chronicle reporter my opinion of the diet making these points:
– one cannot possibly meet nutrient needs on 1200 kcals per day
– sugar and oils are not nutrient dense; they are calorically dense and thus dilute the nutrient density of the total kcal intake.
– 1200 kcals per day is less than the semi-starvation diet used in the only published formal study ever conducted in this country on human starvation (Ancel Keys, 1950)
– human semi-starvation is not a path to health whether one is discussing physical, psychological, or social well-being
– the results of single subject research are applicable only to that subject; they cannot be generalized to others.
– I cannot recommend this diet, in fact, I recommend against it.

In other words: Ridiculous. Her many misconceptions (e.g., she is unaware of many examples of path-breaking self-experimentation in the field of nutrition) aren’t terribly interesting. What’s fascinating is her decision to trash a book she hasn’t read to a large number of her colleagues.

Thanks to Steve Hansen.

Assorted Links

Demand Pricing and the Shangri-La Diet

Demand pricing (also called dynamic pricing) is adjusting the price according to demand. More demand, higher price. It is being considered for movie tickets:

If a movie is hot, the price could rise to whatever the market will bear. For example, I’d have paid $20 per ticket to see “Avatar” in 3-D when it first opened; maybe others would have been willing to pay even more. As demand becomes clear through lower ticket sales, prices would drop. So “Avatar” might cost $15 a few weeks after opening, gradually making its way to $10.

The theory behind the Shangri-La Diet says that body fat is adjusted in a similar way. When food is abundant, the set point (which controls how much fat you have) goes up (= you store more fat). When food is scarce, the set point goes down. This is how many storage systems work, of course; they increase the amount stored when the price is low and decrease the amount stored when the price is high.

Perhaps one day weight control will be explained to children by telling them it is like the price of airplane tickets: “When more people want to go to Los Angeles, the price goes up. When more food is available, your set point goes up . . . “

Percentile Feedback and Productivity

Warning: This post, written for the Quantified Self blog, has more repetition than usual of material in earlier posts.

In January, after talking with Matthew Cornell, I decided to measure my work habits. I typically work for a while (10-100 minutes), take a break (10-100 minutes), resume work, take another break, and so on. The breaks had many functions: lunch, dinner, walk, exercise, nap. I wanted to do experiments related to quasi-reinforcement.

I wrote R programs to record when I worked. They provided simple feedback, including how much I had worked that day (e.g., “121 minutes worked so far”) and how long the current bout of work had lasted (e.g., “20 minutes of email” — meaning the current bout of work, which was answering email , had so far lasted 20 minutes).

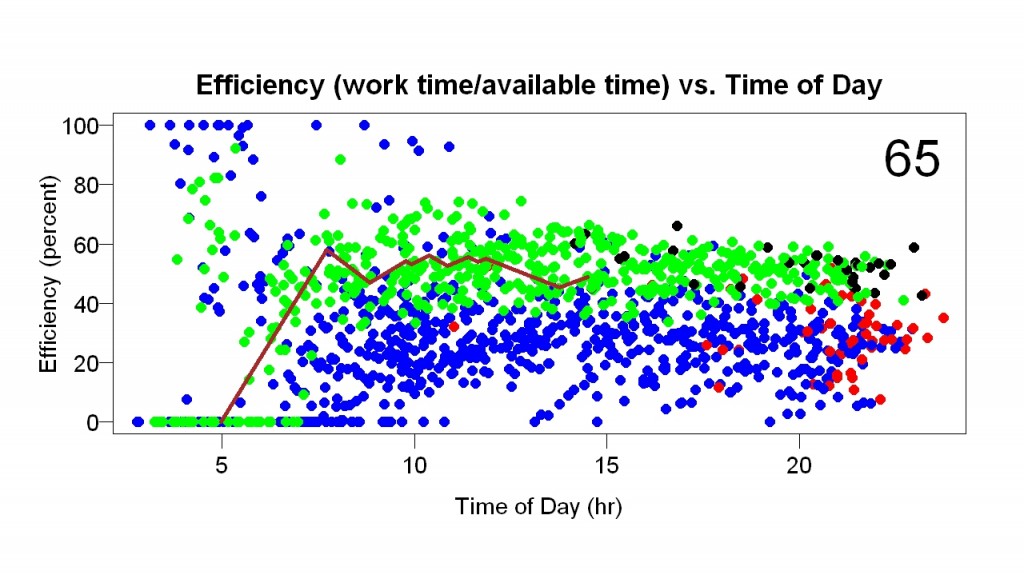
I collected data for two months before I wrote programs to graph the data. The first display I made (example above) showed efficiency (time spent working/time available to work) as a function of time of day. Available time started when I woke up. If I woke up at 5 am, and by 10 am had worked 3 hours, the efficiency at 10 am would be 60%. The display showed the current day as a line and previous days as points. During the day the line got longer and longer.

The blue and red points are from before the display started; the green and black points are from after the display started. The red and black points are the final points of their days — they sum up the days. A week or so after I made the display I added the big number in the upper-right corner (in the example, 65). It gives the percentile of the current efficiency compared to all the efficiency measurements within one hour of the time of day (e.g., if it is 2 p.m., the current efficiency is compared to efficiency measurements between 1 p.m. and 3 p.m. on previous days).

I started looking at the progress display often. To my great surprise, it helped a lot. It made me more efficient. You can see this in the example above because most of the green points (after the display started) are above most of the blue points (before the display). You can also see the improvement in the graph below, which shows the final efficiency of each day.
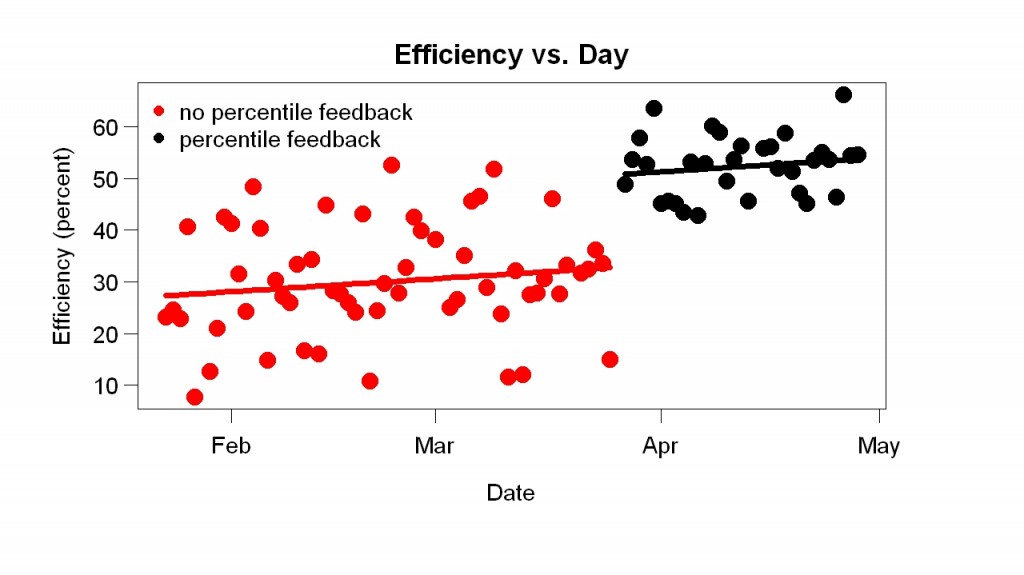
My efficiency jumped up when the display started.

Why did the display help? I call it percentile feedback because that name sums up a big reason I think it helped. The number in the corner makes the percentile explicit but simply seeing where the end of the line falls relative to the points gives an indication of the percentile. I think the graphical display helped for four reasons:

1. All improvement rewarded, no matter how small or from what level. Whenever I worked, the line went up and the percentile score improved. Many feedback schemes reward only a small range of changes of behavior. For example, suppose the feedback scheme is A+, A, A-, etc. If you go from low B- to high B-, your grade won’t change. A score of 100 was nearly impossible, so there was almost always room for improvement.

2. Overall performance judged. I could compare my percentile score to my score earlier in the day (e.g., 1 pm versus 10 am) but the score itself was a comparison to all previous days, in the sense that a score above 50 meant I was doing better than average. Thus there were two sources of reward: (a) doing better than a few hours ago and (b) doing better than previous days.

3. Attractive. I liked looking at the graphs, partly due to graphic design.

4. Likeable. You pay more attention to someone you like than someone you don’t like. The displays were curiously likable. They usually praised me, in the sense that the percentile score was usually well above 50. Except early in morning, they were calm, in the sense that they did not change quickly. If the score was 80 and I took a 2-hour break, the score might go down to 70 — still good. And, as I said earlier, every improvement was noticed and rewarded — and every non-improvement was also gently noted. It was as if the display cared.

Now that I’ve seen how helpful and pleasant feedback can be, I miss similar feedback in other areas of life. When I’m walking/running on my treadmill, I want percentile feedback comparing this workout to previous ones. When I’m studying Chinese, I want some sort of gentle comparison to the past.