When The Shangri-La Diet was published (2006), I enjoyed checking its Amazon rank. The rank got worse. I checked less often. Eventually it was usually above 100,000 and I barely checked at all.
A few months ago, I noticed it was much better than I expected — maybe 40,000. How did that happen? Were sales improving? To find out, I subscribed to RankTracer, which records Amazon rank every hour and plots the results.
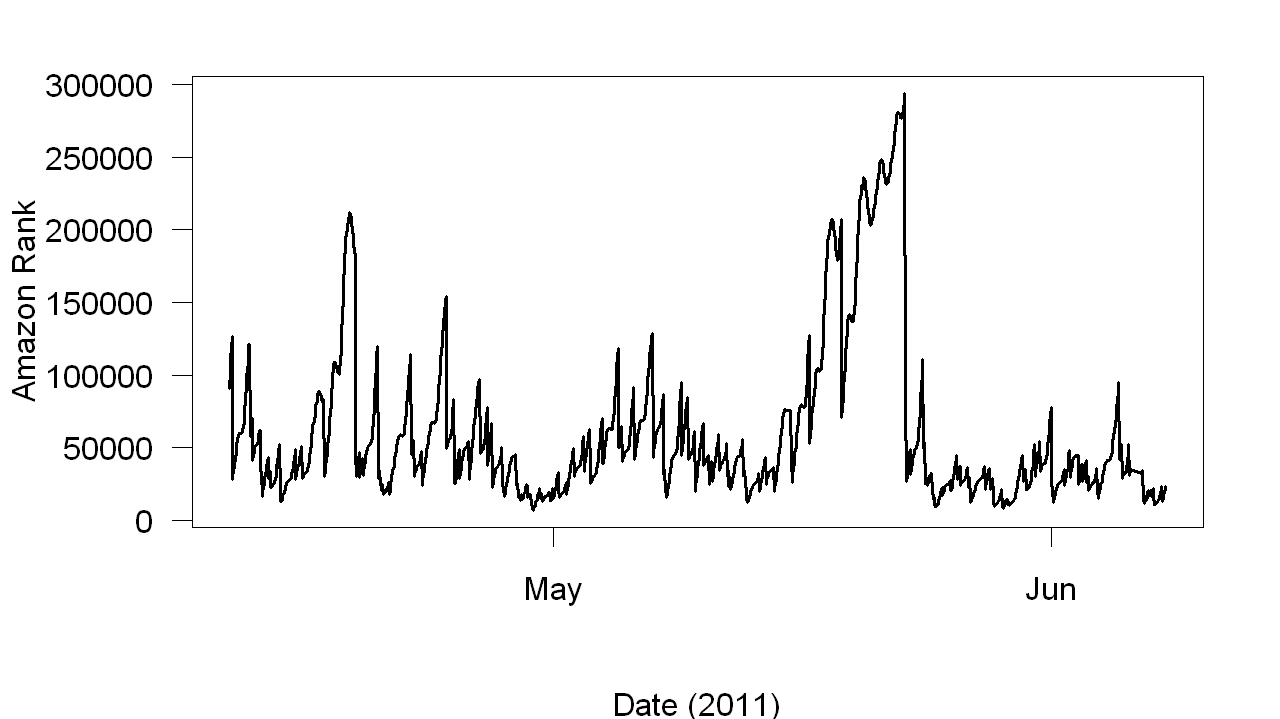
Here are the first two months of data from RankTracer:

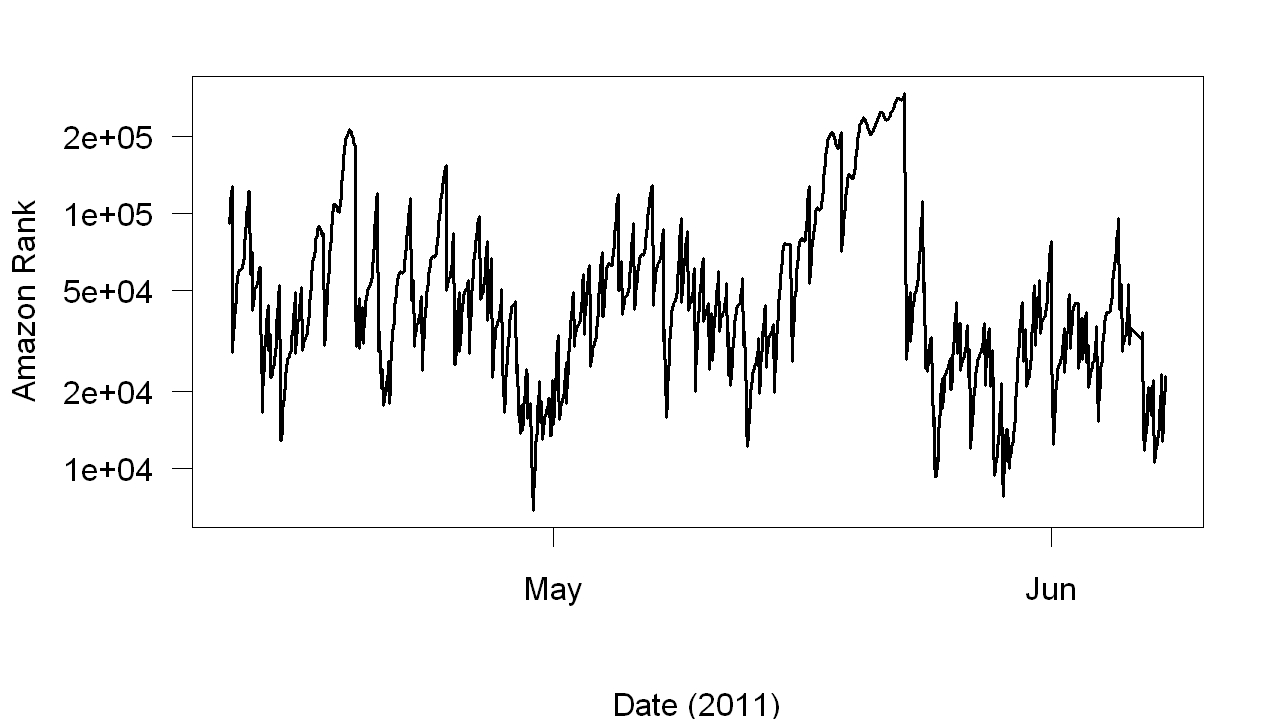
This resembles the graphs that RankTracer makes. Whether the rank is steadily improving isn’t clear. Here is the same data with a logarithmic y axis:

Now steady improvement is obvious.
I’m pretty sure that slowly increasing sales five years after publication is extremely rare. But a bizarre sales record is entirely consistent with two recent comments on the SLD forums. One is this:
It does work, and it is totally boggling that something so counter-intuitive would work. . . . You don’t have to devote your life to starving and working out. One of the best-kept secrets of all time.
The other is this:
I refuse to get drawn into ‘how crazy’ it sounds … I just like the results.
“Now steady improvement is obvious”. I don’t have your experience with data analysis, but the improvement isn’t obvious to me. There seems to be a lot of noise in both plots. Can you explain further?
Steady improvement is not obvious to me either.
Also, rank of your book should be extremely dependent on sales of other books. So this graph is just a comparison and says nothing about absolute sales.
a very well followed biologist Dr. stephen guyenet has posted recently about this exact theory which caused quite a stir in the nutritional blog sphere (https://wholehealthsource.blogspot.com/), no doubt the references made to your work in this field were noted and likely resulted in people seeking you out and buying your book.
kudos!
yeah, that’s a good point. I hadn’t thought of that. On the other hand, being mentioned here or there should simply produce a spike in sales. Perhaps there are such spikes — too small to be clear — but a series of spikes would not produce steady improvement across months, except by coincidence.
Another dataset:
https://www.google.com/trends?q=seth+roberts&ctab=0&geo=all&date=ytd&sort=0
I heard about fat set point in exactly that way, from Stephen Guyenet’s recent posting and interviews. That is what led me to buy the book last month and also read this blog on a regular basis. Mark Sisson has also been singing Seth’s praises recently. It would be interesting to compare the uptick in sales to the blog readership over time.
I agree with Jay above. I’ve seen recent mentions by Tim Ferriss and Quantified Self (of course), as well as Stephen Guyenet and others like this one by Melissa MCewen
https://www.huntgatherlove.com/content/can-complex-flavors-cause-weight-loss
If you fit a straight line to all the points in the lower graph it would have a negative slope. (I did so and the slope had a very high t value — that is, was extremely unlikely to be negative by chance.) Perhaps next time I make such a graph I will include a fitted straight line.
It seems a simple moving average would help see the longer term trend better.
Man, I should submit that RankTracer graph to Junk Charts. Why would you graph something where higher is better with higher at the bottom, and why would you produce a graph that gave equal weight to a move between 50,050 and 50,000 and a move between #50 and #1?
It is reasonable to plot a rank of 1 lower than a rank of 100 — because 1 is less than 100. But you are right about the weighting.
I think referrals from blogs is a likely explanation. My blog linked to you a number of times starting Feb 26, and did two dedicated posts Mar 22 and Mar 24, with more posts since. We have 24,000 monthly unique visitors. An Amazon sales rank of 40,000 is probably about 2 copies per day. That could easily be generated by blog referrals.
You might try checking your referrer traffic to see where web traffic was coming from, and also go back farther than April to see when the sales surge started.
Tim ferriss can be a cause.
He sold millions of books, and seth has a chapter, and an additinal piece in the “bonus” chapters online.
Evidence.
Checking “customers who bought this also bought” on amazon, gives the 4 hour body in tje second page, and i see other items that are frequently bought by ferriss followers
It is reasonable to plot a rank of 1 lower than a rank of 100 — because 1 is less than 100.
Not in sales ranks, it’s not. But maybe I’m just projecting because I personally had trouble flipping the graph upside down to understand it.