The Buttermind Experiment

In August, at a Quantified Self meeting in San Jose, I told how butter apparently improved my brain function. When I started eating a half-stick of butter every day, I suddenly got faster at arithmetic. During the question period, Greg Biggers of genomera.com proposed a study to see if what I’d found was true for other people.

Eri Gentry, also of genomera.com, organized an experiment to measure the effect of butter and coconut oil on arithmetic speed. Forty-five people signed up. The experiment lasted three weeks (October 23-November 12). On each day of the experiment, the participants took an online arithmetic test that resembled mine.

The participants were randomly assigned to one of three groups: Butter, Coconut Oil, or Neither. The three weeks were divided into three one-week phases. During Phase 1 (baseline), the participants ate normally. During Phase 2 (treatment), the Butter participants added 4 tablespoons of butter (half a stick of butter) each day to their usual diet. The Coconut-Oil participants added 4 tablespoons of coconut oil each day to their usual diet. The Neither participants continued to eat normally. During Phase 3 (baseline), all participants ate normally.

After the experiment was finished. Eri reduced the data set to participants who had done at least 10 days of testing. Then she made the data available. I wanted to compute difference scores (Phase 2 MINUS average of Phases 1 and 3) so I eliminated someone who had no Phase 3 data. I also eliminated four days where the treatment was wrong (e.g., in the sequence N N N N N B B N N B, where N = Neither and B = Butter, I eliminated the final Butter day). That left 27 participants and a total of 443 days of data.

Because the scores on individual problems were close to symmetric on a log scale, I worked with log solution times. I computed a mean for each day for each participant and then a mean for each phase for each participant.

2011-01-26 buttermind averages 
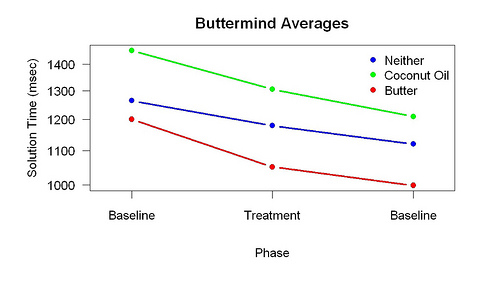
This figure shows the means for each phase and group. The downward slopes show the effect of practice. The separation between the lines shows that individual differences are large. (There was no reliable difference between the three groups during Phase 1.)

The point of the baseline/treatment/baseline design is allow for a large practice effect and large individual differences. It allows a treatment effect to be computed for each participant by computing a difference score: Phase 2 MINUS average of Phases 1 and 3. The average of Phases 1 and 3 estimates what the results would be if the treatment made no difference.

2011-01-29 buttermind difference scores

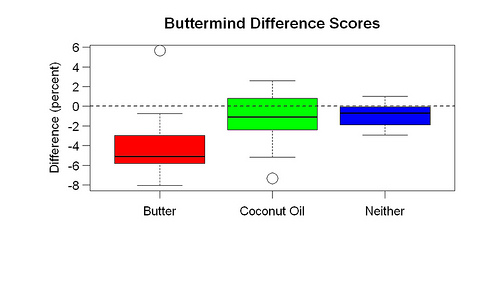
This graph shows the difference scores. There are clear differences by group. A Wilcoxon test comparing the Butter and Neither groups gives one-tailed p = 0.006.

The results support my idea that butter improves brain function. They also suggest that coconut oil does not. In the next post I’ll discuss what else I learned from this experiment.

35 thoughts on “The Buttermind Experiment

  1. You’re handling the data incorrectly. The normal line shows the diminishing returns to practice – the second line segment has a slightly flatter slope than the first line segment. To the extent the ‘kink’ in the butter curve is larger than the normal curve, that shows the effect of butter.
    Your ‘difference score’ is meaningless due to the effect of practice, and the separation between the lines certainly does not reflect the effect of treatment – it reflects the large pre-experiment differences between the groups, which we need an explanation for before we can trust any conclusions drawn.
  2. Seth,
    I don’t understand something.
    Why is the green line so high at the beginning ? should we expect the error bar to go all the way down to the the blue and red starting point ?
    The blue line seems to show how people get accustomed to the test. and the slope is downward, i.e people are getting better and better. The green slope (coconut) seems larger than the red (butter) clearly showing that on average, it is better to go for the coconut than for butter, wouldn’t you say ? It definitely seems to show that it has a lasting effect since the second baseline doesn’t go back up as in the case of the butter.
  3. I agree with Igor. A look at the slopes indicates steeper slopes from Baseline 1 to Treatment and from Treatment to Baseline 2, they look steeper for the two oil conditions than for the Neither condition. Could you compare the slopes statistically to see if this observation is supported?
  4. Andrew, using difference scores is a way of estimating the effect of practice and removing it. Removing effects you can easily see to better see what you can’t easily see is standard statistical practice. Check outExploratory Data Analysis by John Tukey for examples. Although you say the pre-treatment differences are “large”, they aren’t reliable. If you believe that floor and ceiling effects exist, the pre-treatment differences are in the wrong order to explain the difference scores. The Butter group has the least room for improvement but showed the most improvement (as measured by the difference scores).
    Igor, you ask “why is the green line so high?” Answer: There are individual differences between subjects. It was inevitable that the three lines would not start in the same place. Likewise, it was inevitable that they would have different slopes. I agree that if the effect of coconut oil takes a long time to wear off then a longer washout period would have been better.
    Aaron, an exploratory analysis of this data would do more tests, yes, and there is room for more analysis, of course. Here I wanted to keep the tests to a minimum (one) because I wanted to test the hypothesis that butter improves arithmetic scores with as much strength as possible. If your goal is to test an idea you already have, as soon as you do more tests, the power of the tests you have already done is reduced. If your goal is to get new ideas, it’s a different story. I plan to do an exploratory analysis of the data later.
  5. vic, the study you mention, which compared two diets (high-fat/low-carb and standard) does not say what fats composed the two diets. I think some fats make the brain work better, some make it work worse. The study has the peculiar feature that the abstract says that the high-fat diet reduced mood but the results (Table 4) show no difference between the diets. So the abstract is misleading. The study has a small number of subjects (n = 16) and to that extent supports what the buttermind study and my butter and flaxseed oil results suggest: that the fat in your diet has a powerful effect on how well your brain works. Perhaps they injected a lot of bad fat. Bad fat (e.g., corn oil) is much cheaper and more available than good fat.
    Stephan, yes, the participants were aware of the hypothesis. You write “the hypothesis you were testing”. The study was done by Eri Gentry, not me.
  6. Several things puzzle me about this data and hope you can explain.
    1) Rows 518-521 have no Mean in column AJ. Did your calculations use that value (and if so, would R default to a value of 0?)
    2) Many of the Q01 numbers, which I conclude is the first test of any particular day, have a number almost double the value of other daily tests for that participant. Any speculation to the reason? Could it be some kind of time delay due to the initial load of computer resources (since this was an online test)? Or perhaps it is that sometimes people neglected to drink their coffee before the first test? (Examples: rows 18, 19, 28, 32, 33 ).
    3) Is there an explanation for the occasional huge value? (Examples: 38 Q03, 44 Q09, 45 Q08, 180 Q18, to choose a few at random). I suspicion the large value for that particular test due to a coworker at the cubby entrance asking a question, or an urgent chat message, or a glance at the email inbox. Or a slow network. (Have to admit, I’m not thrilled about the ‘online’ portion of the test. I’ve seen way too many stutters in network traffic over the years. Or the remote system logs the transactions and has to wait occasionally for I/O on the disk.)
    4) Some of the data looks inconsistent within one day. For example, row 396, where the numbers bounce back and forth. Q07 = 1641 yet Q09 = 876. Q16 = 611 yet Q17 = 1975.
    Thanks in advance for your time.
  7. Kirk,
    to answer your questions:
    1. I computed means of logs. That is, I computed an average for each subject myself after log transforming the data. I did not use the averages in the table.
    2. Practice effects are often large.
    3. I cannot explain unusually large values, but the log transformed values have few if any clear outliers. Eri Gentry collected the data, not I.
    4. Easy question, hard question? I think it is really hard to know what is inconsistent and what isn’t. If you want to find data generated by a different process you should at least start by looking at log values.
  8. Several more questions:
    5. Do you often find large values in your own testing?
    6. If I remember correctly, you use the R statistic package. Is your R system local or is it being accessed across the network? I suspect it to be local, on a laptop running Windows.
    Local applications are more likely to produce valid data. Although it’s possible there would be competition from some higher-priority process (for example, I see some degradation on my desktop when the antivirus scanner kicks in, and also when Flux starts), generally, laptops and desktops, when serving local applications, have generous resources for handling simple tasks. On the other hand, a timing test being run across networks not only has those two issues to worry about, but also network delays, as well as issues on the remote server (queue depth, process priority, i/o, and others).
    I think it would be illuminating if some of the participants who had large values could comment if he or she noticed anything unusual happening during those large values.
    As of now, until it can be proven that the test design is reliable, I don’t trust this data. It may reflect more a measure of the occasional bottlenecked computer resource than it reflects a measure of human capability as influenced by a biological agent.
  9. Kirk, to answer your further questions:
    5. I don’t know what you mean by “large values”.
    6. I run R on a laptop.
    In my experience all data collection has flaws, usually many. How could “the occasional bottlenecked computer resource” have caused the pattern in the data I identified?
    There is a simple test of your idea. First, make clear what “large values” are — the values you seem to think are due to bottlenecks. You might be right about that. Second, make sure you can repeat the analysis I did and get the same answer. Third, see what happens when those large values are removed. If you explain to me what “large values” are and the definition isn’t arbitrary, I will do the new analysis.
  10. I haven’t taken the analysis in the same direction you took it, because I find the data looks odd, and because it’s odd, it produces strange graphs, as also noticed by Andrew, Igor, and Aaron. I come from the software world where we look at the abnormal data to determine if something is wrong. For example, one often wants transactions to complete in a consistent timeframe, because users can accept a long-running transaction that logically should take a long time because it’s cruising through gigabytes data, but users hate it when a transaction which typically takes 3 seconds sometimes takes three times longer.
    The test, per the text at the Genomera website, consists of 32 simple math questions, and then the overall score is calculated. Let’s look at line 21 on the spreadsheet. This person, on that day, had a low value of 996, or an average of 31.1 per simple math question. (I assume that’s 3.1 seconds per simple math question.) And yet there was a high value of 3268, an average of 102.1. The largest is more than 3 times the average of the lowest. That, to me, is an extraordinary difference for what should be a relatively uniform unit of work.
    This could be the result of a computer bottleneck, or it could be the result of an interruption (coworker asking a question, phone call, urgent text, interesting email). Or maybe it’s really that people sometimes have the occasional brain freeze which results in taking 3 times as long to answer simple math questions.
    During your sessions on your laptop when you solve simple math questions, do you find yourself occasionally taking 3 times as long to answer the questions as you normally do?
    Would any of the participants in the study, the ones who have the occasional large value, care to comment?
  11. You should exclude the first trial for each test, since the timer for the first trial starts as soon as they click “Go”, which is often before they are ready to type in their responses. Responses were a quarter of a second slower on trial 1 than on trial 2, on average, and twice as likely to be over 2 seconds (20% vs. 10%).
  12. Kirk, the data do not look odd when converted to logarithms, in the sense that the data are unimodal, roughly symmetric, and not heavy-tailed. This is common — lots of data make more sense when converted to logarithms.
    I don’t find myself taking 3 times as long as normal but I am very well practiced. Practice reduces variability on a log scale, I suspect.
    If there were computer bottlenecks now and then that makes finding a significant difference more impressive.
    Vince, thanks for the suggestion. It is the sort of thing that it makes sense to examine in an exploratory analysis. To improve future confirmatory analyses.
  13. Seth wrote: “I computed means of logs. That is, I computed an average for each subject myself after log transforming the data.”
    Seth, for those of us who don’t have a background in statistics, can you elaborate a bit on why you analyzed the data in this way?
  14. Perhaps not everyone is on the same page as to what is represented in the spreadsheet. It wasn’t clear to me at first sight.
    Each row contains a single participant’s (1) name, (2) time the test was begun, (3) reaction times in milliseconds for each correct answer (total=32), and (4) average of that test’s reaction time in milliseconds
    We typically see greater reaction times for the first question “Q01,” which I believe is due to adjustment of starting a test. In my own experience taking the test, I was able to mentally prepare myself for the test’s start after practice. This was a little like psyching myself up before some sort of physical exercise.
    Again, in my own experience, my reaction times varied between questions because some answers came to me more quickly than others. This is fairly common. Some people are brilliant at addition and multiplication, but not so much at division. I usually took a moment longer to answer division questions than addition or subtraction. And, when the questions shift from, say addition (1+7=?) to division (6/2=?), it can increase the time it takes to answer because we mentally shift gears.
  15. Thank you for the explanation, Eri, yes, I was confused about the specifics.
    Eri, do you have an explanation for why your data looks extraordinarily different compared to that of other participants? Most people seemed to struggle to get into the 900s, yet your data mostly sits in the 700s and 600s, and you even generated some astonishing low values (in the 200s and 300s). There was only one major ‘burp’, a value of 1464 (when the other row values averaged in the 700s).
    My speculation is that you tested on a local system connected via a local network, just as Seth tests on a local system (his laptop).
    A second question would be about the design itself: does each simple math question require a request/response from the Genomera server to the client, or were all the questions packaged together in one blob, such as a lengthy Javascript, which was shipped to the client, where the questions were answered locally, and the entire summary shipped back to the server?
  16. I have a question for Eri (and/or Greg Biggers) about how the reaction-time application actually works. Is the timing done locally (i.e., on the user’s computer) with the results simply reported back to the server — or is the timing done on the server? And if it’s done locally, is the timing independent of the hardware and independent of other processes that might be running on the user’s machine?
  17. @Kirk, I have no certain technical or metaphysical explanation for why my response times were any different. However, I’ve been typing for years and worked in my parents’ grocery store as a kid, where I added prices together in my head every day. I’m sure both of those skills together gave me a slightly natural advantage. During the study, I simply tried to respond correctly as quickly as possible.
    For all but one of the testing days, I was using a laptop tethered to the internet via an android phone, as I had neither wireless nor hard-wired internet. So, I was by no means connected locally.
    I remember the ‘burp.’ I typed the wrong answer, deleted, and retyped the right answer. I remember because that aggravated me. =/ Btw, great eye to attention for catching that!!!
    Kirk, if you haven’t already, I definitely recommend trying the math test for yourself (link above). The experience will likely inform some of your previous questions.
    @Alex, below is a response by our lead developer to a question similar to yours. Hope it helps!
    ”’
    I can’t speak to Seth’s R program. For ours, I altered the jQuizMe plug-in by adding responseStartTime and responseEndTime variables. I bookended them on the tightest path I could find within the plugin. Certainly there is a bit of intervening plug-in plumbing, but I don’t believe it’s adding any sort of interesting lag. (The modified JS is at https://s3.amazonaws.com/genomera/instruments/math/scripts/jquery.quiz.jsif anyone wants to have a read through particularly poorly crafted javascript. You can search for anything I added by “[jtz]”.)
    If we feel like there’s a problem, I can construct a static HTML test harness that measures millisecond response time within the context of a single function. This would get the jquery plug-in stuff out of the way. We can each take it and see if there is some kind of meaningful change.
    At the very least, I’m going to state that our instrument is consistent. So, even if it’s ‘slow’, it’s not going to skew the data.
    ”’
    I want to point you all to our feedback page athttps://getsatisfaction.com/genomera
    We have used this as place to host questions and answers about Butter Mind and the math test used for it.
  18. @Eri, thank you for the explanation of the large value. My conclusion is that the larger values, say, any of those which are double the value of the mean for that participant, are probably the result of a miscalculation (or miskeying) which resulted in a correction.
    The explanation of the use of the Javascript package seems appropriate. It is not a language I know so I can’t review it, but since Javascript was chosen, it proves to me that good design minds understood how to solve this kind of problem space, and thus network latency is probably not an issue.
    I agree the data shows that people improve at this task over time. I find myself reluctant to draw further conclusions, given the limited amount of data, the continued improvement with practice, and the high penalty for mistakes. Would the results be different if those who made the most mistakes have been assigned to another group? Yet here I must bow out, having exhausted my meager capabilities at data analysis.
    One final learning: never challenge Eri to a quick-draw gunfight.
  19. @Kirk, I should be clearer about the large values. The one I mentioned above was due to a “bug,” if you will, in the system: when two keys were hit at once, no answer was submitted. However, two numbers would remain in the answer field – which was ALWAYS a wrong answer in our test – so, the one taking the test would have to delete both numbers and re-answer.
    Other large values could be due to things you suggested: various distractions or thoughtful hesitation.
    A few more things of note about the test design and how data was collected:
    – Only correct answers were submitted. Reaction times were collected for all correct answers and the test continued until the user achieved 32 correct answers. There is technically no penalty for wrong answers (data is thrown out); however some users mentioned this had the effect of “psyching them out,” bringing their confidence levels down for the remainder of the test. I believe this effect decreases over time, though I have nothing to back it up but observations of myself.
    – Questions were designed to have only single-digit answers [0-9], and
    – Questions automatically advanced after a single keystroke, whether number, letter, or symbol. Any incorrect stroke was called wrong and tossed out. The only bug I saw here was the one I mentioned – when, if two keys are hit simultaneously, the question does not advance (even though the answer is clearly wrong), but must be corrected by manual deletion then entry of a single item.
    Kirk, I appreciate the time you’ve spent thinking about the data. Certainly, there is room for improvement in group experiment study design, and even in building the tools to complement different studies. My hope is that more people like you will engage to help create resources on both sides. Generally, being at the beginning of an age that has “room for improvement,” AKA one the will keep getting better (with this one, perhaps, the participatory health age… unless some better name sticks :P) is a really exciting place to be.
    I’ll keep doing studies like this and plan to directly integrate user feedback as I move forward. So, everyone, please keep ideas flowing, and thanks for sharing!
    Lastly, re: the gunfight… hehe. Thanks, I’m strangely flattered:)
  20. Hi Seth,
    I never met you, but I’m Mel’s sister. I followed a link to your blog from an email she sent me. This is very funny that you did an experiment like this. I actually do a lot of experimenting myself with nutrition since I was a kid…although never a “real” one like this.
    Raw grassfed butter or sometimes other animal fats has been a big part of my diet for years (10). I sometimes go through 2-3 lbs a week. I have noticed clarity of mind to be a factor of my fat intake. I also found other neurological symptoms like anxiety, neuralgia, MS like symptoms, that have come and gone depending on the source of fat I am using. Fun to look through your blog.
  21. I really enjoyed reading this discussion. I think discussions like these are helpful, and will push us citizen scientists to create well designed studies and generate meaningful results. I definitely enjoyed all of the really good technical discussion about the instrument, potential bias due to latency, internet connection speed, etc. It is interesting how we all have such different perspectives, as i would not have immediately thought of this as an issue.
    On the issue of data integrity and validity of results, i think a lot of things that happened in this study are pretty common in any clinical study: significant data outliers, potential technical errors in data capture, etc. In any study (even $100M pharma-sponsored trials) you will have these issues. Even simple blood tests get messed up, have variability in the measurement, etc. This is just part of the intrinsic variability you will see in any study, and you will try to compensate for it by studying a large enough population. I agree with Seth and Eri that this does not harm the study at all. As long as you assume that these ‘errors’ are equally balanced between the arms (meaning there is no reason why Butter should have more errors than Coconut oil), this should not adversely impact, or skew, the result. The worst thing you could do here is start to throw out ‘outliers’ because you think there must be something wrong with their results. Then you have really biased the data and damaged the study.
    There are a couple of ways to proactively try to address some of the challenges with these potential ‘errors’. Most commonly, is simply randomization. When a subject enters the study you assign them to Arm X or Arm Y of the study. You pre-specify things you think could influence the result (age, gender, other baseline characteristics, co-morbid diseases, fast typing in this case, etc) and you make sure all of these parameters are equally balanced between the arms. The other is to set up a priori some data analysis rules (ie. you could specify before the study that results 3 standard deviations away from the mean are ‘bad’ and exclude them from the analysis). This poses all sorts of problems usually, and will open the study to controversy.
    Eri, one thing that would be really interesting in a next wave is to see if you could employ some form of randomization. one thing that strikes me from the study that i would like to fix is the different average baseline values for the 3 arms. In this case, i agree with Seth that Butter started out with the least room to improve, yet improved the most. If Coconut Oil had improved the most, i would not have believed the result and assumed it was regression to the mean. I wonder if you could tell people what intervention to use after they did a run-in test without butter or coconut oil. then you could ‘balance’ the coconut oil and butter arms so that they started from the same average baseline number. this would make the result a lot easier to interpret, and would just be cool if you could pull it off. just for another random thought you could also have them do a typing speed test if you think this is a source of bias, and try to randomize on that as well.
    The only real question i had is on using a Log transform of the data to do the analysis. i know this is common in other fields (mathematics, physics, etc), i am just not sure if this is commonly done in biostatistics and analysis of clinical data. i will ask a biostats friend of mine if this is a common practice or is specifically not done for some particular reason.
    Thanks again for a good discussion.
  22. Celeste, how does your fat intake affect your mental clarity?
    Chris Hogg, I hope you will tell me what your biostatistician friend says about data transformation. It isn’t controversial; you can see for example Exploratory Data Analysis by John Tukey for a discussion of the reasons for transformation. However, many biostatisticians seem to be living in a statistical dark age, the most obvious signs of which are they don’t plot data, they don’t transform data, and they do too many tests.
  23. Seth, I’m now two weeks into fish oil supplementation, and a week into adding sardines and butter (1/2 to 1 stick a day). Today during my workout I noticed the weights moved faster than last workout even though I increased the weight since last time.
    I’m 38 years old, 175 pounds and 6’1. Today’s workout was all conventional deadlifts without a belt or straps:
    135 x 10
    135 x 10
    205 x 5
    Work sets:
    275x 4 x 4 (73ish% of 1 Repitition Max)
    315 x 1 x 2 (86ish % of 1RM)
    345 x 1 x 2 (94ish % of 1RM)
    I’m not taking any anabolic or androgenic compounds. Since some of the higher weights seems to be dependent on the CNS, I wonder if I have gotten a bit of a boost from the additional oils in the diet. My pace was very fast tonight with short rest times between sets so I was really suprised how quickly the bar moved tonight.
  24. I’d like to see some kind of testing done to verify that these reaction-time applications (Seth’s R code and Genomera’s web-based app) give accurate and precise measurements that are independent of hardware, operating system, network traffic, and other processes running on the machine. Not sure exactly how to do this — maybe by writing code that is able to simulate pressing keystrokes? Or, perhaps less practically, some kind of hardware device that is able to press keys?
    In any case, because the interpretation hinges on fairly small changes in reaction time, I think it makes sense to invest some time to ensure the validity of the data-gathering tools.
  25. Alex, there is error in all measurements. It would be a staggering coincidence if the error in my measurements changed at exactly the time I changed to eating lots of butter. Likewise, it would be a staggering coincidence if the error in the Genomera measurements strongly correlated with the butter/no butter treatment. Try randomly sorting the butter/no butter subjects into two groups and see how often you observe a difference as large as the difference actually observed. This is the purpose of p values — to estimate the chances of the difference you observed being due to something other than what you varied.
  26. Seth, yes, but if you wanted to know the value of the absolute improvement in reaction time, you’d have to know whether the tool was giving you results that were true. Also — and I’m far from an expert on statistics — if it turned out that the reaction-time application gave noisy readings that fluctuated +/- 20% from the true value, would this fact not make it more difficult to separate the signal from the noise in these types of “Buttermind” experiments?
    In any case, perhaps I’m being irrational, but when I weigh myself every morning, I like to know that I’m tracking not only changes in weight but also the real weight itself. That’s why I always check my bathroom scale against the higher-end scales in two different doctors’ offices, whenever I have an appointment.
  27. Seth,
    I see that with that much participants we got a significant but not earth shaking p-value. While in your own data, you usually show very strng p-values.
    Why is there such relative weakness in the data here of other people relative to you?
    Do you think you have more stability in other changes so that there is less noise in your data? Better calibrations? Whatever?
    Training effect?
    Or because this group just had a very short time and three conditions?
    I am wondering because I am contemplating to group people for self experimentation, and these data are somewhat of an indication that maybe it is harder to get significant results than i initially thought

Leave a Reply

Your email address will not be published. Required fields are marked *