Here are more graphs of the data in the Post Your Tracking Data Here section of the Shangri-La Diet forums. An overall summary of that data is:
Persons posting data for at least 1 week: 92
Total weeks of data: 930
Persons posting data for at least 4 weeks: 57
Persons posting data for at least 12 weeks: 31
Total weight change (ld): -985
Average rate of change (ld/week): -1.1
The graphs below show analyses similar to those I have done previously now divided by sex.
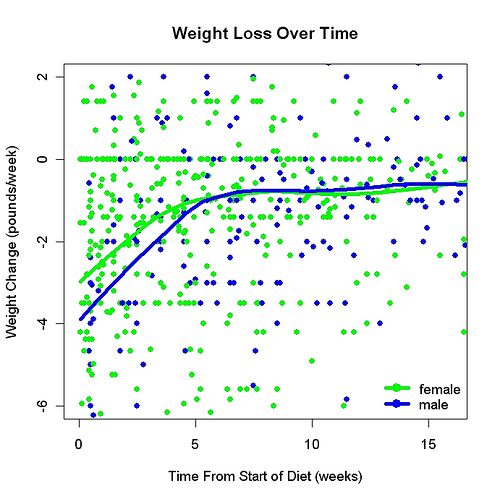
Weight loss slows down during the first five weeks of the diet. After that it is about one pound per week. In the beginning men lose weight more quickly than women but this difference disappears after five weeks or so.
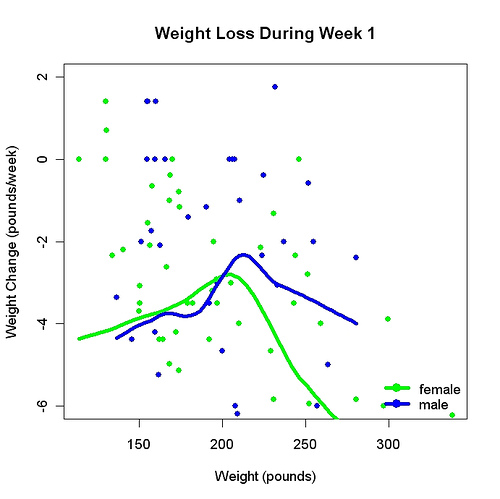
During the first week of the diet, weight loss depends on how much you weigh: The more you weigh the more you lose, at least if you weigh more than 200 pounds. This graph compares men and women equating for weight — and when that is done there is no clear difference. The male/female difference seen in the first graph may be entirely due to weight differences: Men weigh more than women.
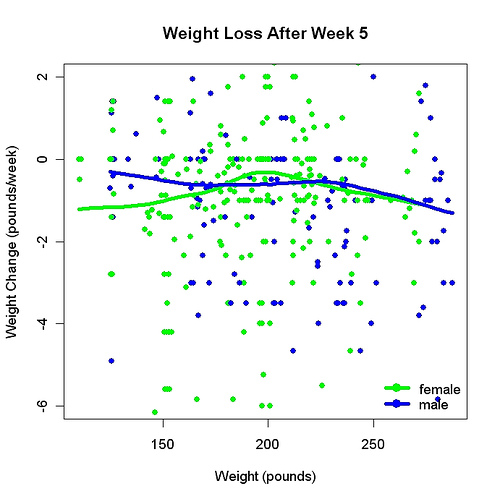
After Week 5 there is little difference between the sexes and little difference between people of different weights.
For easy comparison with earlier analyses see my Flickr page
The results support the popular idea that men lose weight more easily than women but also argue that this may be because men weigh more than women.
Seth,
Do you have any data, especially average weight loss data on other weight loss programs and diet pills?
No I don’t.