I use R, the open-source version of S, several times/day. More often than I use Word. It works far better than S — fewer bugs, much cheaper (R is free) — and S worked a lot better than what it replaced (STATGRAPHICS). I was pleased to see a NY Times article about it:
R has also quickly found a following because statisticians, engineers and scientists without computer programming skills find it easy to use.
“Easy to use” — haha! Non-statisticians and non-engineers don’t find it easy to use, in my experience, but it’s true that I found it easy to use. “R has a steep learning curve” some people say, twisting the meaning of “steep learning curve” (which should mean fast learning, since that’s what a steep learning curve describes).
The popularity of R at universities could threaten SAS Institute, the privately held business software company that specializes in data analysis software. SAS, with more than $2 billion in annual revenue, has been the preferred tool of scholars and corporate managers. . .SAS says it has noticed R’s rising popularity at universities, despite educational discounts on its own software, but it dismisses the technology as being of interest to a limited set of people working on very hard tasks.“I think it addresses a niche market for high-end data analysts that want free, readily available code,” said Anne H. Milley, director of technology product marketing at SAS. She adds, “We have customers who build engines for aircraft. I am happy they are not using freeware when I get on a jet.”
Ah, “freeware.” You may remember when “Made in Japan” was derogatory. Most psychology departments, including Berkeley, use SPSS (Statistical Package for the Social Sciences). Like SAS and its ten feet of manuals, it is horrible. One of my students wanted to make a scatterplot of her data. She went to the psych departmental statistics consultant (a psych grad student who had taken courses in the statistics department). The statistics consultant didn’t know how to do this! A scatterplot! It’s like Vladimir Nabokov’s observation at Cornell and other schools of language professors who couldn’t speak the language they taught. Nothing But the Best describes a Julliard composition teacher who couldn’t read music. To be a scientist and not be able to analyze your own data is pretty much the same thing. With R making a scatterplot is easy.
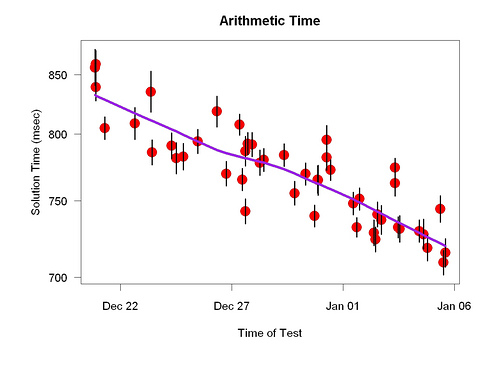
To me, the value of R is that it makes high-quality data analysis available to everyone — something very new in the history of mankind. R makes self-experimentation easier because it makes data analysis easier and allows you to learn more from the data you have collected (e.g., make better graphs). I also use it for data collection — measuring how well my brain is working.
Via Andrew Gelman.