SLD Side Effects

On the SLD forums, you can read about many positive side effects of drinking oil. (One of them — better sleep — caused me to start studying the effects of omega-3.) Today three people posted some more:

  • I used to get those little cracks in the sides of my mouth. After just a few days on the diet, those are gone! I can open my mouth as far as it will go and no cracks!
  • My feet/heels don’t seem to be getting hard/cracked like they were
  • My skin feels softer
  • I haven’t had an asthma attack since starting in March.
  • Mental calmness. Situations that used to bother me now just slide away. It is hard to describe, but the peacefulness is wonderful.
  • I conclude that a big nutritional deficiency has been corrected.

    What fraction of people with (a) dry or cracked skin, (b) asthma, and (c) irritability have been told to consume more fat, I wonder? Zero? In the case of the asthma and irritability, I expect the improvement comes from a fat high in omega-3.

    A Modern Microscope

    Reading this legal complaint — suing a florist who gave the plaintiffs far less than agreed-upon at a very expensive wedding — I feel I am peering into a kind of microscope. Something far away and very small in the big scheme of things — the plaintiffs’ frustration — is made very clear. It reminds me of The Devil Wears Prada (no art but lots of emotion) but the legal complaint is even more evocative.

    Why Do We Like Warm Food?

    Yesterday I cooked some chicken. Today I reheated the leftovers. While eating them, I had a gruesome thought: Warm food is more pleasant than food at room temperature. Could the evolutionary reason be that it is better to eat freshly-killed meat (warm) than meat killed yesterday (room temperature)? Or did a preference for warm food evolve because it caused us to prefer cooked food (sterilized) to uncooked food (unsterilized)?

    Sure, thermoregulation is involved. We like warm food more when we’re cold; we like cold food more when we’re hot. Michel Cabanac has done brilliant experiments about our changing preference for hot and cold environments. But there is an overall preference for warm food. We like warm food even when we’re not cold.

    In spite of thousands of books and articles promoting this or that “natural” diet, it has been incredibly hard to determine what our ancient ancestors ate, the diet that presumably fits us best. One way has been to ask what modern-day hunter-gatherers eat. Not only do their diets vary widely but also they are clearly not typical: They live in meager environments. So that is hopeless, although Weston Price showed that there was a lot to be learned by studying earlier foodways. Price was surprised to find how much those ancient foodways differed from each other yet all produced good health.

    The most basic questions about our ancient diet remain unanswered. Did our ancestors eat lots of meat (savannah evolution) or lots of fish (aquatic ape theory) or neither (vegetarian proponents)? In spite of looking, Price never found a group that ate little meat that was in the best health, so I doubt the vegetarians. I suspect ancient peoples ate lots of fish at first and then started eating lots of meat as they spread away from the coasts. My main evidence for the fish is my omega-3 results that imply our brains work best with lots of omega-3. My main evidence for the meat is the huge popularity among boys of video games that contain elements of hunting. It’s hardly great evidence, of course, since the popularity of those games, and of actual hunting, has other plausible explanations.

    This is why my omega-3 self-experimentation interests me so much. It is a way to figure out the best diet for our brain. It relies on fast simple cheap easy-to-control experiments that anyone can do, rather than on epidemiology (correlations) or expensive slow hard-to-control clinical trials that often involve unusual people.

    The Silent Spring of Marching Bands

    Rachel Carson’s Silent Spring, about the damage done by pollution, “is widely credited with launching the environmental movement in the West” (Wikipedia). Along similar but narrower lines, last week’s USA Today had an article by Joyce Cohen about hearing damage caused by being in a marching band. It begins:

    There’s no bigger booster of his marching band than Mark Claffey. “I am a total band nerd!” declares Claffey, a drummer for the Golden Falcons at Franklin Heights High School in Columbus, Ohio.

    There’s just one downside. At age 17, he has painful ear damage.

    He says that, after indoor rehearsals, his ears started hurting, then ringing.

    Now, he’s abnormally sensitive to sound. If someone cranks the car radio, “I get a sharp shooting pain in my right ear,” says Claffey. . . .

    It’s the dirty little secret of the halftime show: Marching band . . . can cause irreparable hearing damage, according to Brian Fligor, director of diagnostic audiology at Children’s Hospital in Boston.

    The director of a professional group of music teachers claimed that knowledge of this problem is fairly new. That’s absurd, Joyce said. Stories about hearing problems among musicians have been published in medical and professional journals for at least two decades. Music teachers don’t acknowledge their own hearing problems, several experts told her, because doing so could endanger their livelihoods. Band parents, known for their fanaticism, were sometimes dismissive. They claimed that pain and ringing in the ears are normal.

    The Indianapolis Star, published by Gannett, which also owns USA Today, reprinted the article. On the newspaper’s forums, readers started a debate about whether there should be laws to protect students’ hearing.

    Memorial University Defends the Indefensible

    In 1993, Marilyn Harvey, who at the time was Ranjit Chandra’s research assistant, came forward to say that a paper by Chandra reported research that didn’t happen. Memorial University conducted an investigation that failed to confirm her (very courageous) allegation. About that investigation, Ranjit Chandra’s Wikipedia entry says the following:

    The vice-presidents were unable to secure the data, and, as a consequence, were unable to verify research fraud conclusively.

    Huh? Harvey’s claim was that the data didn’t exist!

    This sentence was written by Peter S. Morris, Director of Public Affairs at Memorial. I emailed Morris to try to find out how it could make sense. Presumably it made sense to Morris. Alas, Morris would not explain it. He did say that to prove research fraud — in Chandra’s case, the fraud of making up data — you need the data. You read that correctly: To prove that someone has made up data you need to have the data, Morris asserted. He wouldn’t explain that, either.

    Memorial’s behavior did great harm to Marilyn Harvey, as you can read in the complaint filed with her lawsuit.

    How Interesting is Good Calories, Bad Calories?

    Very.

    The single most striking result in the history of the cholesterol controversy . . . passed without comment by the authorities: those Framingham residents whose cholesterol declined over the first fourteen years of observation were more likely to die prematurely than those whose cholesterol remained the same or increased. They died of cardiovascular disease more frequently as well.

    Around 1990, nineteen studies found that both women and men had higher total mortality at the lowest cholesterol levels (< 160). The increase came from more “cancer, respiratory and digestive diseases, and trauma.” From Gary Taubes’ fascinating new book Good Calories, Bad Calories.

    I expect these results are corrected for income but I’m not sure. A friend of mine is very poor. “You have the cholesterol level of a Chinese peasant [i.e., very low],” his doctor once told him.

    Interview with Taubes (October 9).

    Exit Wounds

    Tonight, by accident, I attended a talk by the Israeli artist Rutu Modan about her graphic novel Exit Wounds. I learned:

    1. One day in 1914, Franz Kafka wrote in his diary, “Germany invaded Russia. Swimming lessons in the afternoon.”

    2. Browsing at a flea market, she found an album of pictures of her dead father. Her family had given it away by mistake. When she told the seller about this, he raised the price from $4 to $150.

    3. She wrote Exit Wounds in Hebrew but drew it in English. No kidding. She wrote the text in Hebrew and had it translated into English. The balloons where the words go were arranged to read from left to right. For a forthcoming Hebrew edition, she made mirror images of everything. There was just one problem: Cars were on the wrong side of the road. 150 panels (the hero is a taxi driver) have this problem. She has been forced to do some redrawing.

    Interview with Andy Maul about Test Development (part 3)

    5. What are you doing to develop a better test?

    Not being a content expert in either emotions or intelligence myself, I have no plans at the moment to create a test of emotional intelligence. Instead, my goal is to explore and discuss, firstly, better ways of engaging in the iterative process of construct exploration and test development, and secondly, better methods of test analysis. These are, of course, interrelated.

    The “classical” method of test construction in psychology goes like this: a) decide what you want to measure (formally or informally); b) write items to measure it; c) pilot those items; d) run basic statistical analyses, such as Cronbach’s alpha e) remove the items from the test that are the least reliable with the other items, thus improving the reliability of the test, and f) publish.

    This process usually yields a reasonably reliable test. A problem with this approach is that nowhere did we allow the
    process of test construction to inform our theory development. Test construction can be as much a process of construct exploration as anything else, if we allow it. For instance, think-alouds and exit interviews can help us understand what subjects are actually thinking as they take the test, and whether the variation in the ways people approach the items truly reflects variation in the construct we think we’re measuring. The exercise of construct mapping can turn a murky idea of what we’re measuring into a much clearer one, by laying out a priori theories about what kinds of items measure what levels of the construct, and those ideas can then be empirically tested later, which makes the analysis phase much more informative than it traditionally is. And, of course, I would be remiss if I didn’t mention the analysis itself: item response modeling often affords valuable information missed by classical analysis, such as information on person and item “fit” (which, to be interpretable, requires going back to the theory of the link between the items and the construct itself, which once again benefits from thoughtful construct mapping) and information about dimensionality at the item level (as opposed to the branch level, which is where confirmatory factor models—such as the ones used to investigate the structure of the emotional intelligence tests I’m working with—traditionally concentrate).

    Doing things in this manner usually takes more than one iteration, which is one reason people might not like it. So far, the MSCEIT has been developed and evaluated, and the test developers have spent a good deal of time debating other authors in the literature concerning the value of the test, but the analyses have not yet led to test revision (except in the manner I described above: that items with poor reliability were dropped, without any particular theory about *why* they were unreliable).

    So, in other words: I won’t claim to be a substance expert enough to be able to write a new test of emotional intelligence on my own, but I would like to use the measurement efforts in this field as a way to discuss construct exploration and instrument development in psychological research.

    Part 1. Part 2.

    Reference

    Wilson, M. (2005) Constructing Measures: An Item Response Modeling Approach. Lawrence Erlbaum Associates: Mahwah, New Jersey.

    The Apparent Spread of SLD

    The number of visitors to the Shangri-La Diet forums has been growing. This graph shows, for each day, the maximum number of people accessing the forums at one time. (When you load a page, I guess you are considered “at” the forums for some length of time.)

    most online by day

    “Most online” has steadily increased since January. These values are closely correlated with the number of visitors in a day, for which I have less data.

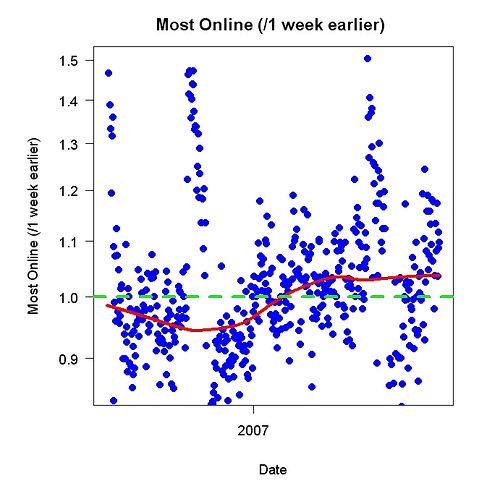
    Here is another way to look at the most-online data. Each most-online value is divided by the value from one week earlier.

    rate of change of most online

    Perhaps the rate of increase is increasing but it isn’t clear.

    Will it live?