More Weight-Loss Data from the Shangri-La Diet Forums

Here are more graphs of the data in the Post Your Tracking Data Here section of the Shangri-La Diet forums. An overall summary of that data is:

Persons posting data for at least 1 week: 92
Total weeks of data: 930
Persons posting data for at least 4 weeks: 57
Persons posting data for at least 12 weeks: 31
Total weight change (ld): -985
Average rate of change (ld/week): -1.1

The graphs below show analyses similar to those I have done previously now divided by sex.

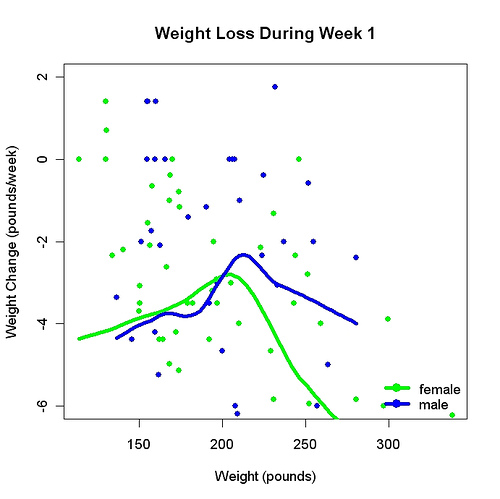
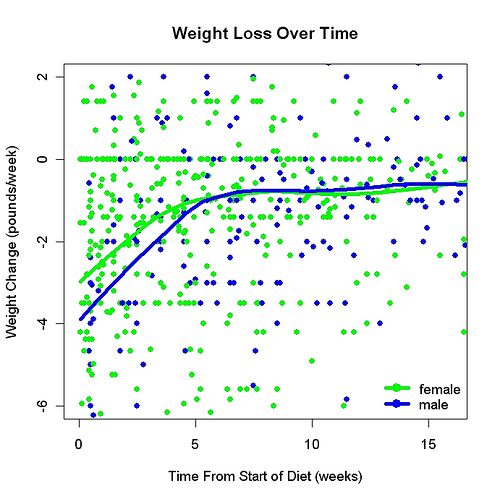
Weight loss slows down during the first five weeks of the diet. After that it is about one pound per week. In the beginning men lose weight more quickly than women but this difference disappears after five weeks or so.

During the first week of the diet, weight loss depends on how much you weigh: The more you weigh the more you lose, at least if you weigh more than 200 pounds. This graph compares men and women equating for weight — and when that is done there is no clear difference. The male/female difference seen in the first graph may be entirely due to weight differences: Men weigh more than women.

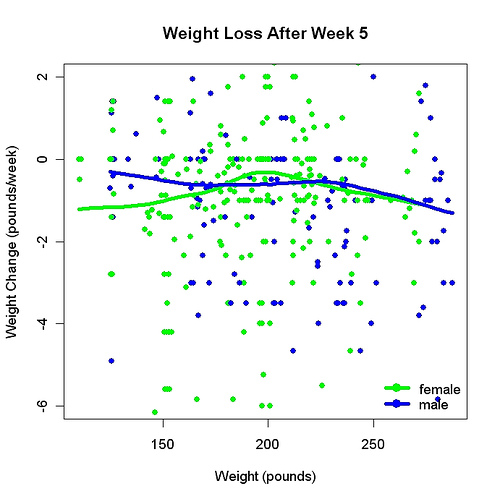
After Week 5 there is little difference between the sexes and little difference between people of different weights.

For easy comparison with earlier analyses see my Flickr page

The results support the popular idea that men lose weight more easily than women but also argue that this may be because men weigh more than women.

The Truth Is Out There

I was very pleased to read this on the Shangri-La Diet forums:

Hi everyone! My name is Cindy. I’d learned of this in quite the ironic way. Killing time on YOUTHINK.com, I came across the question, “Would you ever try the Shangri-La Diet?” Having never heard of it before, I decided to google it. 5 hours later, I was sold. The recurring thing I kept reading in blogs, reviews, etc, was amazement that this actually worked.

That is a limitation of the statistics I posted today: They don’t express amazement.

On Scientific Method

When I visited George Mason University recently, I asked Tyler Cowen, “What’s the secret of a successful blog?” Cowen and Tabarrok’s Marginal Revolution is the most successful blog I know of.

His answer: “Three elements: 1. Expertise. 2. Regularity. 3. Recurring characters, like a TV show.” By regularity he meant at least 5 times/week.

I saw I had considerable room for improvement. Since then, I’ve tried to post at least twice/week. With this post I am adding scientific method to the subtitle, which I hope makes me appear more expert. A Berkeley philosophy professor named Paul Feyeraband wrote a book that I thought is called On Method but that I see is actually called Against Method. He was at Berkeley when I arrived. I remember two things about him: 1. He gave all his students A’s. 2. He ate at Chez Panisse every night.

The Wisdom of Experts: John Chambers on Research Design

John Chambers, a retired Bell Labs statistician and one of the persons most responsible for R, the free open-source data analysis package I use, told me an interesting story yesterday. AT&T used to make microchips. The “yield” of chips — the percent of chips that were defect-free — was very important. Chambers and other Bell Labs statisticians were asked to help the chip makers improve their manufacturing process by increasing the yield. At the chip factory, the people Chambers and his colleagues spoke to were chemists and engineers. They wanted to do experiments that varied voltage, temperature, and similar variables. Chambers and his colleagues had a hunch that the operator — the person running the fabrication machines — was important, and this turned out to be true.

I like this story because it has a wisdom-of-crowds-but-not-exactly twist: the supposed experts at one thing (data analysis) turned out to have useful (and unpredictable) knowledge about something else. We don’t think of statisticians as experts in human behavior but in this case they were at least more expert than the chemists and engineers. I mean: who were the experts here? And when we deal with someone, which is more likely: We overestimate how much they can help us with our problem? Or we underestimate (as in this story, where the chip makers underestimated the statisticians)? And if we have no idea which it is, how might we find out?

I told Chambers that statisticians were hurt by the name of their department: statistics. It puts them in too-small a box. John Tukey’s term data analysis (in place of statistics) was an improvement, yes, but only a bit; it would be a lot better if they were called how-to-do-research departments. Yes, Chambers said, that would be an improvement.

I am fascinated by the similarity between three things:

1. Data analysis. Much of data analysis consists of putting data together in a way that allows you to extract a little bit of information from each datum. These little piece of information, added together, can be quite informative. A scatterplot, for example.

2. Wisdom-of-crowds phenomena. For example, many people guess the weight of a cow. The average of their guesses is remarkably accurate, even though the variation in guesses is large.

3. Self-experimentation. The new and interesting feature of my self-experimentation was that it involved my everyday life. From activities I was going to do anyway (such as eat and sleep), I managed to extract useful information.

In each case it’s like extracting gold from seawater: You get something of value from what seemed useless. Are there other examples? How can we find new examples? Chamber’s story suggests one direction: Making some small change so that you learn from your co-workers about stuff you wouldn’t think they could teach you about.

Brian Wansink on Research Design

An experiment in which people eat soup from a bottomless bowl? Classic! Or mythological: American Sisyphus. It really happened. It was done by Brian Wansink, a professor of marketing and nutritional science in the Department of Applied Economics and Management at Cornell University, and author of the superb new book Mindless Eating: Why We Eat More Than We Think (which the CBC has called “the Freakonomics of food”). The goal of the bottomless-soup-bowl experiment was to learn about what causes people to stop eating. One group got a normal bowl of tomato soup; the other group got a bowl endlessly and invisibly refilled. The group with the bottomless bowl ate two-thirds more than the group with the normal bowl. The conclusion is that the amount of food in front of us has a big effect on how much we eat.

There are many academic departments (called statistics departments) that study the question of what to do with your data after you collect it. There is not even one department anywhere that studies the question of what data to collect — which is much more important, as every scientist knows. To do my little bit to remedy this curious and unfortunate imbalance, I have decided to ask the best scientists I know about research design. My interview with Brian Wansink (below) is the first in what I hope will be a series.

SR: Tell me something you’ve learned about research design.

BW: When I was a graduate student [at the Stanford Business School], I would jog on the school track. One day on the track I met a professor who had recently gotten tenure. He had only published three articles (maybe he had 700 in the pipeline), so his getting tenure surprised me. I asked him: What’s the secret? What was so great about those three papers? His answer was two words: “Cool data.” Ever since then I’ve tried to collect cool data. Not attitude surveys, which are really common in my area. Cool data is not always the easiest data to collect but it is data that gets buzz, that people talk about.

SR: What makes data cool?

BW: It’s data where people do something. Like take more M&Ms on the way out of a study. All the stuff in the press about psychology — none of it deals with attitude change. Automaticity is seldom a rating, that’s why it caught on. It’s how long they looked at something or how fast they walked. That’s why I’ve been biassed toward field studies. You lose control sometimes in field studies compared to lab studies, but the loss is worth it.

The popcorn study is an example. We found that people ate more popcorn when we gave them bigger buckets. I’d originally done all that in a lab. So that’s great, that’s enough to get it published. But it’s not enough to make people go “hey, that’s cool.” I found a movie theatre that would let me do it. It became expensive because we needed to buy a lot of buckets of popcorn. Once you find out it happens in real theatres, people go “cool.” You can’t publish it in great journal because you can’t get 300 covariates; we published it in slightly less prestigious journal but it had much greater impact than a little lab study would have had.

One thing we found in that study was that there was an effect of bucket size regardless of how people rated the popcorn. Even people who hated the taste ate more with the bigger bucket. We asked people what they thought of the popcorn. We took the half of the people who hated the popcorn the most — even they showed the effect. But there was range restriction — the average rating in that group was only 5.0 on a 1-9 scale — not in the “sucky” category. Then we used old popcorn. The results were really dramatic. It worked with 5-day-old popcorn. It worked with 14-day-old popcorn — that way I could say “sitting out for 2 weeks.” That study caught a lot of attention. The media found it interesting. I didn’t publish the 5-day-old popcorn study.

I’m a big believer in cool data. The design goal is: How far can we possibly push it so that it makes it a vivid point? Most academics push it just far enough to get it published. I try to push it beyond that to make it much more vivid. That’s what [Stanley] Milgram did with his experiments. First, he showed obedience to authority in the lab. Then he stripped away a whole lot of things to show how extreme it was. He took away lab coats, the college campus. That’s what made it so powerful.

SR: A good friend of mine, Saul Sternberg, went to graduate school with Milgram. They had a clinical psychology class together. The professor was constantly criticizing rat experiments. This was the 1950s. He said that rats were robot-like, not a good model for humans. One day Milgram and my friend brought a shoebox to class. In the box was a rat. They put the box on the seminar table and opened it, leaving the rat on the table. The rat sniffed around very cautiously. Cautious and curious, much more like a person than like a robot. It was a brilliant demonstration. My friend thinks of Milgram’s obedience experiments as more like demonstrations than experiments. But you are right, they are experiments consciously altered to be like demonstrations. Those experiments were incredibly influential, of course — it supports your point.

BW: When we first did the soup bowl studies, we refilled the soup bowls so that we gave people larger and smaller portions than they thought had. We heated the soup up for them but gave them 25% more to see if they would eat more than they thought. You could put that in an okay journal. The bottomless soup bowl would be more cool. Cool data is harder to get published and it’s much more of hassle to collect the data, but it creates incredible loyalty among grad students, because they think they are doing something more exciting. It’s more of military operation than if they are just collecting some little pencil-and-paper thing in the lab. It makes research more of an adventure.

Another thing: field experiments are difficult. There’s a general tendency in research to be really underpowered with things [that is, to not have enough subjects]. Let’s say you’re doing the popcorn bucket study. Is the effect [of bucket size] going to come out? Rather than having too many cells and not get significance, it’s a good idea to have fewer cells — replace a manipulated variable with one or two measured variables. For example, instead of doing a two-by-two between-subjects design we might have a design when one factor is measured rather than manipulated. If the measured factor doesn’t come out you haven’t lost anything; you still have all the power. With the popcorn study we knew the study would work with the big bucket [that is, we knew there would be an effect of bucket size] but we didn’t know if there would be an effect of bucket size if we gave them [both good corn and] bad corn [thereby doing a two-by-two study] and only 200 people showed up [leaving only 50 people per cell]. So when we did the field study for the first time, we gave them all popcorn 5 days old. We measured their taste preference for popcorn then used it as a crossing variable. We used scores on that measure to divide the subjects into two groups.

SR: Let’s stop here. This is great stuff.

——————————————————-
Most of the VCP-310 professionals advice against PMI-001 and suggest going for EX0-101 instead, proceeding to CCIE-LAB finally.

Ranjit Chandra Update

If you have been following the strange case of Dr. Ranjit Chandra, you may be interested to know:

1. He has sued the CBC (Canadian Broadcasting Corporation) because of a documentary they ran last year titled “The Secret Life of Dr. Chandra”. A lawyer for the CBC told me last week the lawsuit is at a very early stage.

2. A paper about Dr. Chandra’s research by Saul Sternberg and me has been accepted by Nutrition Journal, an open-source journal. Our third and final paper on the subject.

The Wikipedia entry for Chandra has a good summary of the story so far.

Crazy-Spicing 3.0: Fava Bean Crostini

Here is another way — in addition to ELOO, refined walnut oil, other flavorless oils, sugar water, nose-clipped smoothies, crazy-spiced smoothies, and nose-clipped food in general — to get “SLD calories” — by which I mean food that raises your set point much less than usual. I love this dish.

How to make crazy-spiced fava bean crostini:

1. Soak dried fava beans for 12-24 hours. I make about 1 pound at a time. One pound of beans makes about 6 servings.

2. Skin the beans. I make a small tear along the rim of the bean and then push the inside out. Takes a few seconds per bean. Discard the skins.

3. Cook the beans. I put them in a crockpot on high for 3 hours covered in water but any cooking method is okay.

4. Mash the beans, adding finely chopped onion and your favorite oil. I usually use flaxseed oil. The onion is for texture. At this point I have several meals worth. I store it in the refrigerator.

5. Slice a ciabatta-like bread into long thin pieces. Toast.

6. Add random spices to the beans. I use 4 or 5 Penzey’s spice blends. If the beans have been refrigerated I warm them in the microwave before this step.

7. Spread the bean mixture on the toast.

8. Add an interesting topping, which can be almost anything. I have used tomatoes, cooked mushrooms, and chopped arugula.

Background.
Crazy spicing means adding randomly-chosen spices (say, 10-20) to your food so that the flavor is unrecognizable. The theory behind the Shangri-La Diet predicts that this will cause weight loss. No flavor recognition = no set point increase = lower set point = weight loss. The closest thing to a test of this prediction — making the flavor of food less recognizable will cause weight loss — was an experiment done by Alan Hirsch, a Chicago neurologist. A few hundred people sprinkled flavor crystals on all of their food for six months — one flavor for savory foods, another for sweet. The flavor crystals changed once a month. The subjects lost a substantial amount of weight.

The problem with adding random spices to ordinary food is the feeling of loss — “Alas, my beloved X.” Crazy Spicing 2.0 — crazy-spiced smoothies — solved this problem by putting the spices in a homemade smoothie, which does not have an expected taste (so no feeling of loss) and can also be made to taste good in ways that do not involve flavor recognition (sweet, salty, creamy, cooling, and thirst-quenching). Smoothies, however, do not look like ordinary food nor are they crunchy and chewy — something I’ve noticed I especially want now that I eat less. The fava bean crostini look fine — I had something similar at Chez Panisse — and have a great texture. They are wonderfully crunchy and chewy. Toppings can make the texture even better.

Notes. 1. I have tried less expensive, less glamorous beans just once; the texture was less appealing. It is not far from hummus (garbanzo bean paste), however. I have not tried garbanzo beans. 2. Add the spices once per meal. Each meal a new set of spices, in other words. If you add the spices just once and then eat the result many times, it becomes a ditto food. 3. Beans have a low glycemic index, another good feature of this dish. 4. To make it more nutritious, you can add protein powder or almost anything else you would add to a smoothie. It already has lots of fiber. 5. This is something I make far in advance. Make it on Sunday, eat for the rest of the week, for example. The only lengthy step — skinning the beans — I actually enjoy. 6. Why do I love this dish? Because of the full-bodied crunchiness and chewiness. Because it looks as good as restaurant food. Because the toppings allow room for creativity. Because once I have made a batch, it takes just a few minutes to make a meal’s worth (toasting the bread is the most time-consuming part). Because I’ve always liked fava beans.

CIA Fun Facts

Tonight, at a panel discussion at UC Berkeley that was part of The New Yorker College Tour, I learned two things about Central Intelligence Agency headquarters in Langley, Virginia:

1. There are scales in the bathrooms (according to Lawrence Wright).

2. There is a gift shop that sells CIA golf balls and the like. By the register is a notice: “If you are a covert operative, don’t use your credit card” (according to Jeffrey Goldberg).

The big shock, however, was neither of these. It was, as Hilary Goldstine pointed out, that there were almost no undergraduates in the audience. Which speaks volumes about UC Berkeley. It was a great discussion. Jane Mayer was the third discussant and Orville Schell the moderator.

Tea, Wine, Chocolate — and Coffee

Jacob Grier, who works in a coffee shop, has written to say that coffee deserves to be on my list of connoisseur-type foods with health benefits (previous entries: tea, wine, and chocolate). For the health benefits of coffee, read this and this. Thanks, Jacob. In Berkeley, Peets (coffee) and Scharfenberger (chocolate) have created several products together. Let’s see: Peets and Scharfenberger, Teance and Charles Chocolates . . . the wine/chocolate category seems underpopulated. By eerie coincidence, today I watched an episode of Weeds (Season 1, Episode 3) in which the heroine goes to a cannabis club (dispensing medical marijuana) where she learns about fancy grades of marijuana she never knew existed.

Tea, Wine, and Chocolate: A Puzzle

Last night I went to the opening of the lovely Teance store on Fourth Street (Berkeley). Teance specializes in Asian teas, with some Indian teas as well. They used to be elsewhere in Berkeley, but their lease ran out. At the new location, they replace a gift shop, which makes sense: Fourth Street is foodifying. Teance fits well with the other upscale food stores in the area, such as the Pasta Shop.

But enough about small business. At the opening, someone from a local tea appreciation society gave a brief talk. Two things he said made me think. One was: “We drink tea for fun. The health benefits are just a bonus.” The other was a comparison of tea and wine. Tea is now where wine was thirty years ago. Since then there has been a vast increase in wine appreciation. “Thirty years ago if it was a special occasion you drank a bottle of Blue Nun. Now every kid on a skateboard knows the difference between merlot and cabernet sauvignon.”

Wine has health benefits, of course. A few weeks ago I went to a little tour/talk/demonstration at Charles Chocolates in Emeryville, where a few of the fine points of making chocolates (the candies, not the raw ingredient) were explained. Chocolate, too, has health benefits, as the makers of Cocoavia will be happy to explain. (Charles Chocolates has partnered with Teance to produce a line of tea-flavored chocolates, which were served at the opening.)

Three foods with intense connoisseurship action, three foods with substantial health benefits:

1. Wine

2. Tea

3. Chocolate

A coincidence? Or meaningful? Will cheese turn out to have health benefits? As a general rule, connoisseurship and health are unrelated: That hand-painted Italian flatware is no better for you than K-Mart’s finest (at least before the partnership with Martha Stewart, who called their customers “K-Martians”.)

I became interested in connoisseurship because of my interest in human evolution. Connoisseurship evolved, I believe, because it supported high-end craftsmanship. Skilled craftspeople were the main source of technological innovation. Connoisseurs happily pay more for high-end, carefully-made stuff. The tea spokesman was right: We drink it for fun.