Yogurt Accident/Discovery

I’ve made yogurt a few hundred times, mostly with a yogurt maker (picture below). The usual recipe is 1 quart milk, 1/4 teaspoon whey (from previous batch), incubate 24 hours. Yesterday, after incubation finished, I opened the machine to find this:

The milk (now yogurt) had squeezed together to form a perfectly round disc a few inches thick. It had squeezed out all the whey. The only unusual feature of this batch — besides the fact that it is getting warm and relatively humid here in Beijing — is that I used maybe 10% less milk than usual. This difference means the pulling inward force was less resisted by sticking to the sides, so this outcome indeed was more likely than usual.

This is my yogurt maker.

I bought it because it came with a glass bowl. Most yogurt makers have only a plastic bowl. You simply pour the milk in the glass bowl, add the starter (whey), add hot (boiling) water around the glass bowl, and wait a day — infinitely easier than the insanely complicated yogurt recipes I find on the Web. And I am beginning to think the hot water is unnecessary.


Dear Gmail: Publish Break-in Stats

A year ago my gmail account was hacked. I recovered it in an hour or so, not before a friend of mine had an amusing conversation. Recently, judging by James Fallows’s experiences, there has been a rise in these attacks. My mistake, I believe, was using the same password on my gmail account and another account. I suspect the recent outbreak of gmail break-ins is happening because there was recently a large exposure of passwords elsewhere.

But I can’t be sure because I cannot compare break-ins over time. What does a graph of break-ins-versus-time look like? Is what Fallows has noticed a recent spike? (It probably is.) If so, that supports my explanation of its cause (passwords lost elsewhere). Or has there been a steady increase over time? That would contradict my explanation. It is revealing that Fallows provides two security suggestions, one of them really time-consuming (two-stage verification) in the long haul. He says nothing about making sure your gmail password is not used anywhere else. If he could have seen that break-ins-versus-time graph, he could better judge whether the gmail hacks are due to duplicated passwords. If I am right about the cause of these hacks, Suggestion #3 should have been don’t use your gmail password anywhere else — and would have been the most effective.

Gmail developers can help all of us be safe at reasonable cost by publishing graphs that show break-ins (and probability of break-in) per day. I think that is estimated by the number of account recovery requests they receive per day. After my gmail account was hacked, I contacted Google to recover it and soon did. Perhaps those account recovery requests could involve the person making the request giving a reason (e.g., “account hijacked”). Then Google could simply tell us (with a graph?) the number of hijacked accounts reported per day.

Security departments and others don’t like to provide this sort of information. Persons at the top of companies worry it will scare customers! Those in security departments worry people will be less scared — thus reducing their power. From a user point of view these are horrible reasons not to make this information public. With accurate knowledge of the likelihood of break-ins, gmail users can make reasonable estimates of the costs and benefits of various security options. Without knowing the likelihood of break-ins, they can’t.

Assorted Links

Thanks to Craig Fratrik, Tom George and Sean Curley.

Downward Spiral of Whole Foods House Brand

My friend Carl Willat sent me this photo with the comment “noticeably worse” — meaning that the new version (on the right) is noticeably worse than the old version (on the left). 365 is the Whole Foods house brand. Years ago,the label of 365 balsamic vinegar said “aged 5 years”. Then one day it didn’t. The younger vinegar (aged 1 year?) tasted noticeably worse. In a side-by-side comparison, it was obvious.

Side-by-side comparisons, I discovered thanks to Carl, are powerful — and I could use that power to improve my life. A long time ago at his apartment I tasted five versions of limoncello (Italian lemon liqueur) side by side. Of course the differences became clearer–that’s obvious. The surprise was that all of a sudden I cared about the differences. Before that tasting, I had had plenty of limoncello. But only at the side-by-side tasting did I develop a liking for the good stuff (more complex flavor) and a dislike for the cheaper stuff (simpler flavor). I stopped buying cheap limoncello and started buying expensive limoncello. I got a lot of pleasure out of it. I still do this. A few weeks ago I bought some rum to flavor my yogurt. I started with the cheapest brand. A week later, to compare, I got a more expensive brand. Side-by-side tasting showed it was clearly better. Now I sort of relish it — the side-by-side comparison made rum drinking more enjoyable. Soon I will get an even more expensive rum, to see how it stacks up.

I’m pretty sure such side-by-side comparisons are how connoisseurs are made. The evolutionary reason for this effect, I believe, is that connoisseurs will pay more than other people for well-made stuff, thus helping skilled artisans — during the Stone Age, the main source of innovation — make a living.

In Carl’s picture the new vinegar looks much cheaper than the old vinegar. The previous change (from aged 5 years to not aged 5 years) wasn’t accompanied by a cheaper-looking label. Maybe Whole Food headquarters had received complaints from manufacturers of other balsamic vinegars: Your house brand is too good. And they replied: Okay, we’ll cheapen it.

Another Reason the Shangri-La Diet is Not More Popular

On my Psychology Today blog someone left a surprising comment about why the Shangri-La Diet isn’t more popular:

Seth, I’ll tell you why. Because we are majorly competitive bitches, we women who care about our appearance. I’m 41, I have three children and I am a size 6. I fit into my wedding dress and the jeans I wore in college. How? Shangri-La. And there is no way in hell I am going to share my secret with anyone.

Went to the movies this weekend with a group of friends. They had the usual movie fare, I ordered a cup of tea (bag on the side), added two tablespoons of sugar (put the teabag in my purse for later), sipped it slowly throughout the movie, had not ONE craving for the popcorn or nachos or M&M’s everyone else was scarfing. I went home and had a light dinner and felt terrific!

Sounds more like an ad than an actual comment, but it could hardly be more vivid and I believe it.

Statins Reduce Cholesterol But Not Heart Disease Progression

The notion that high cholesterol (more specifically, high “bad” — LDL — cholesterol) causes heart disease may be as widely accepted as the notion that humans have caused dangerous global warming. It is much easier to test, however. An excellent study published in 2006 compared two groups of people at risk for heart disease: those given a high dose of statins and those given a low dose. The high dose reducd LDL cholesterol levels; as it was meant to; the low dose did not. But there was no effect on coronary heart disease progression. After a year of statins, persons in both groups had increased their coronary artery calcification score by the same amount — about 25%. Totally contradicting the cholesterol hypothesis.

Regular readers of this blog may remember that after a year of eating butter (half a stick per day), my coronary artery calcification score decreased 24%. Because increases of about 25% are the norm, my score was about 50% less than expected. Decreases are very rare, I was told.

Thanks to Hyperlipid. Statin side effects.

Shangri-La Diet Success Story

On the Shangri-La Diet forums I found a link to this:
Weight Chart

A middle-aged man named Kainin has lost about 60 pounds since September (7 months) and described his experience in great detail. On Weight Watchers, he lost 40 pounds in 6 months before gaining it all back (plus 10 pounds more) — he started at 290, went down to 250, and back up to 300. On Nutrisystems, he lost 20 pounds in 6 weeks before gaining it all back. So the Shangri-La Diet has already helped him more than those two methods, not to mention being easier.

At the end of February, his BMI went below 35, the level indicating Morbid Obesity.

To celebrate I went to the local party store to look for a mylar balloon saying something like “Congratulations on being just Obese!” but found — NOTHING! The closest I found was a bereavement balloon that read “Sorry for your Loss”. Not exactly what I was looking for.

The roughly 100,000 posts on the SLD forums make the case for the diet far better than I ever could. Now, if I could just get rid of spammers …

Effect of Graphical Feedback on Productivity: Another Look

A few months ago, inspired by talking to Matthew Cornell, I started tracking when I was working. After a while I added graphical feedback like this:

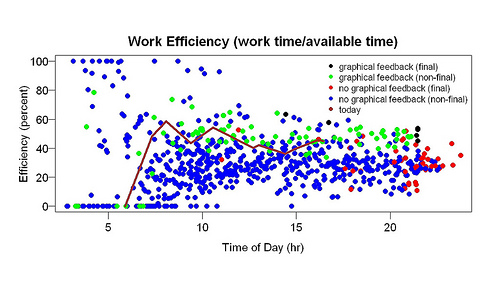
The graph shows efficiency (time spent working/time available to work) versus time of day. The line shows the current day (not today, the current day when I made this graph). The higher the line, the better. When I work it goes up; when I take a break it goes down. The points are previous days. When the line is higher than the points, I am doing better than previous days. As I said in my first post, this seemed to help a lot: compare the green points (after graphical feedback) to the blue points (before graphical feedback). I blogged about possible explanations.

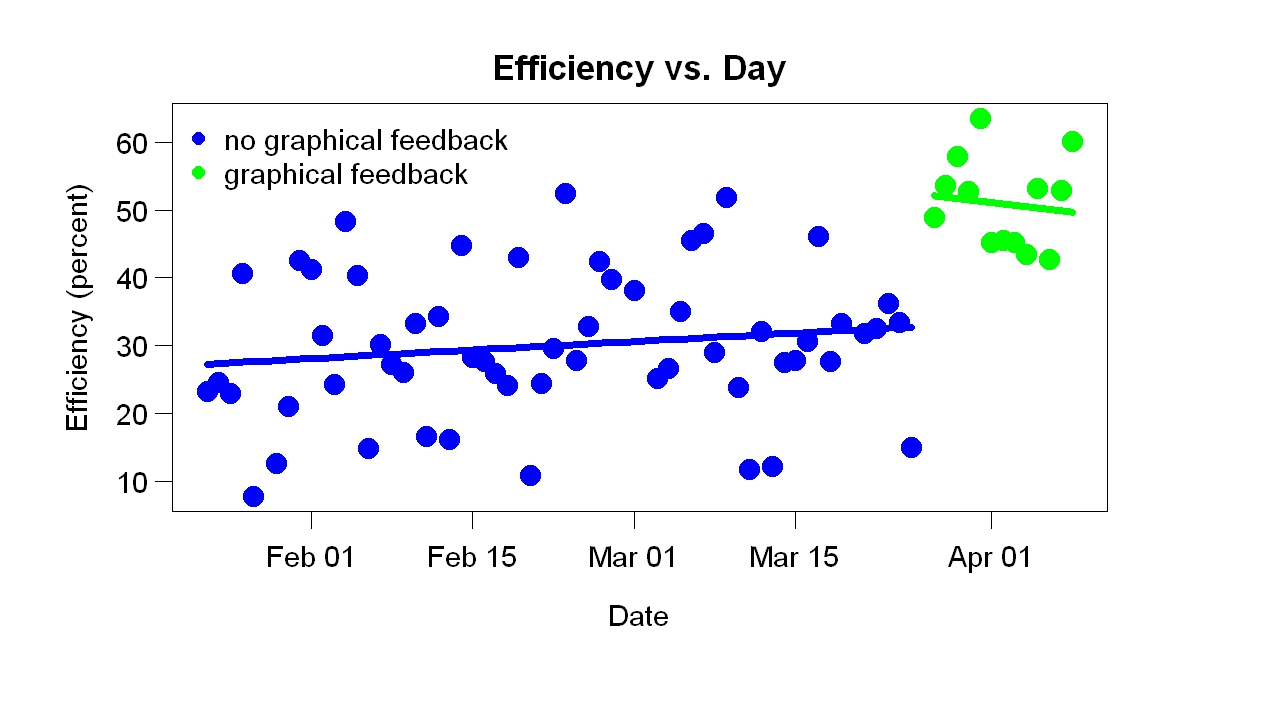
Here is more analysis. This graph shows efficiency versus day. Each point is the final efficiency (the efficiency after my last bout of work that day) for one day (the black and red points on the previous graph). These results suggest that the graphical feedback caused a sudden improvement, supporting the impression given by the blue/green (before/after) comparison of the earlier graph.

Before graphical feedback, the graph shows, efficiency was slowly increasing. Perhaps that was due to measuring when I was working, but I suspect it was due to the text feedback I got. I often used my tracking system to find out how long my current bout of work had lasted and how much I had worked so far that day. (For example, right now the text feedback is “15 minutes of blog, 73 minutes today”, which means I’ve spent 15 minutes writing this blog and before that worked 58 minutes on something else.)

Let me repeat what I said in another post: This was a big surprise. I collected this data for other reasons, which had nothing to do with graphical feedback. Before this project, I had made many thousands measurements of work time, but they were (a) tied to writing, not all work and (b) recorded inside the program I use for writing (Action Outline). Using R would have been slightly harder — that’s why I used Action Outline. I never studied the data, but I had the impression it helped.

You may know about the brain-damage patient H.M. His brain damage caused loss of long-term memory formation. He could remember something for a few minutes but not longer. The researcher working with him had to keep introducing herself. A pleasant side effect was that he could read the same thing again and again — a magazine article, for example — and enjoy it each time. This is like that. I am stupid enough that the results of my self-experimentation continue to surprise me (which I enjoy). You might think after many surprises I would stop being surprised — I would adjust my expectations — but somehow that doesn’t happen.

My Theory of Human Evolution: New Version

After a casual article, a talk, and many blog posts about my theory of human evolution, I managed to write a book chapter about it. Blogging helped. You may remember the ideas that language began because it increased trade and art began because it increased innovation. However, the center of the theory isn’t language and art, but procrastination. Above all, humans are the animals that specialize and trade. That’s obvious. Not obvious is that specialization begins with repetition — doing something over and over makes you an expert. The tendency to repeat had to be attachable to all sorts of activities, so that our ancient ancestors become expert at a wide range of things and could trade with each other. The mechanism behind this arbitrary repetition made it easy to repeat what you did yesterday and hard to do something new. Nowadays it does the same thing and thereby causes procrastination — difficulty starting something new.

The arbitrary day-after-day repetition began before trade. I believe it began when our ancestors were still hunting and gathering, like chimps. At some point there was a long-lasting surplus of food. The surplus lasted so long that it became beneficial to specialize while foraging. I suspect the great surplus was the discovery and exploitation of seafood, just as Elaine Morgan says, but what caused the abundance doesn’t matter for my theory. Specialization during foraging led to specialization during free time (hobbies). Trade began, part-time jobs (trading your specialty for necessities) began, and, when the pile of knowledge grew big enough, full-time jobs began.

The notion that repetition is behind expertise is supported by the idea that people who are really good at something have practiced a lot — say, 10,000 hours. I am saying two new things here: 1. Repetition is increased by hedonic changes: We want to repeat what we did yesterday. Doing something today makes it more pleasant to do tomorrow. 2. It’s not just superstars, such as the Beatles and Wayne Gretzky (Malcolm Gladwell’s examples), it’s everybody. Arbitrary repetition is behind Adam Smith’s “division of labour”. Our whole economy grew from a tendency to repeat today what you did yesterday.