Percentile Feedback and Productivity

Warning: This post, written for the Quantified Self blog, has more repetition than usual of material in earlier posts.

In January, after talking with Matthew Cornell, I decided to measure my work habits. I typically work for a while (10-100 minutes), take a break (10-100 minutes), resume work, take another break, and so on. The breaks had many functions: lunch, dinner, walk, exercise, nap. I wanted to do experiments related to quasi-reinforcement.

I wrote R programs to record when I worked. They provided simple feedback, including how much I had worked that day (e.g., “121 minutes worked so far”) and how long the current bout of work had lasted (e.g., “20 minutes of email” — meaning the current bout of work, which was answering email , had so far lasted 20 minutes).

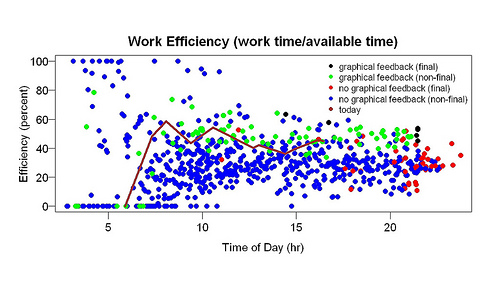
I collected data for two months before I wrote programs to graph the data. The first display I made (example above) showed efficiency (time spent working/time available to work) as a function of time of day. Available time started when I woke up. If I woke up at 5 am, and by 10 am had worked 3 hours, the efficiency at 10 am would be 60%. The display showed the current day as a line and previous days as points. During the day the line got longer and longer.

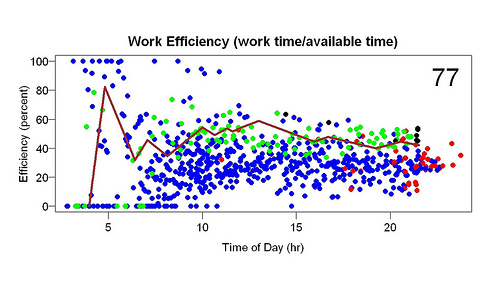
The blue and red points are from before the display started; the green and black points are from after the display started. The red and black points are the final points of their days — they sum up the days. A week or so after I made the display I added the big number in the upper-right corner (in the example, 65). It gives the percentile of the current efficiency compared to all the efficiency measurements within one hour of the time of day (e.g., if it is 2 p.m., the current efficiency is compared to efficiency measurements between 1 p.m. and 3 p.m. on previous days).

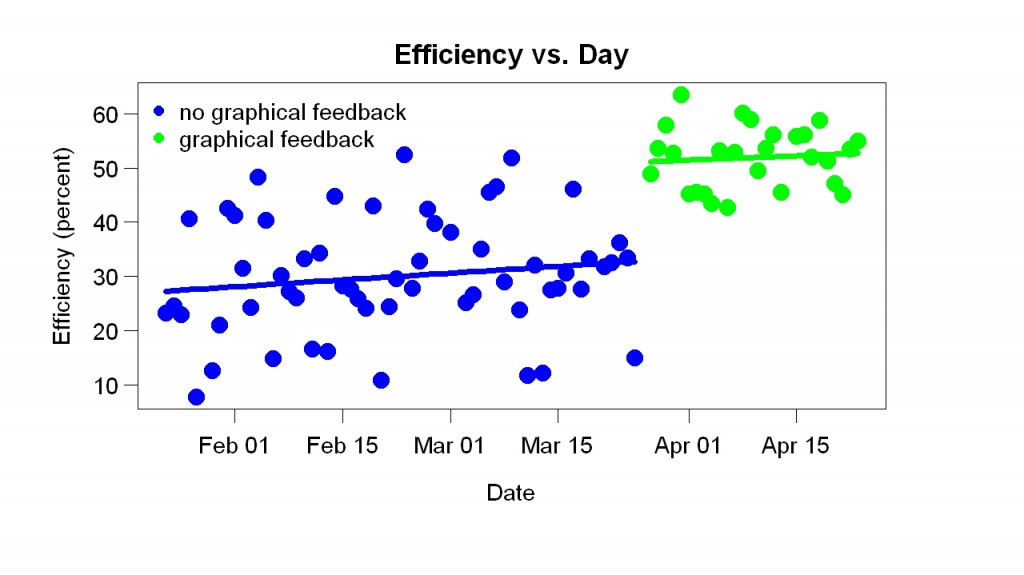
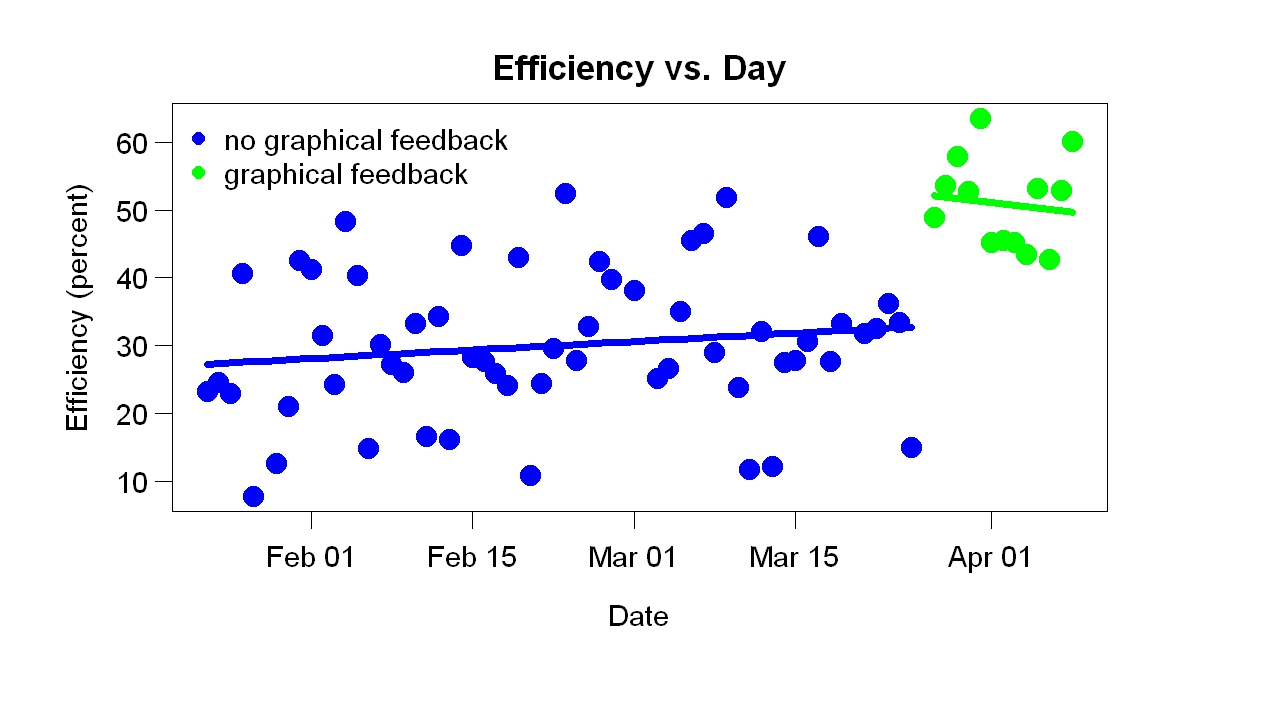
I started looking at the progress display often. To my great surprise, it helped a lot. It made me more efficient. You can see this in the example above because most of the green points (after the display started) are above most of the blue points (before the display). You can also see the improvement in the graph below, which shows the final efficiency of each day.

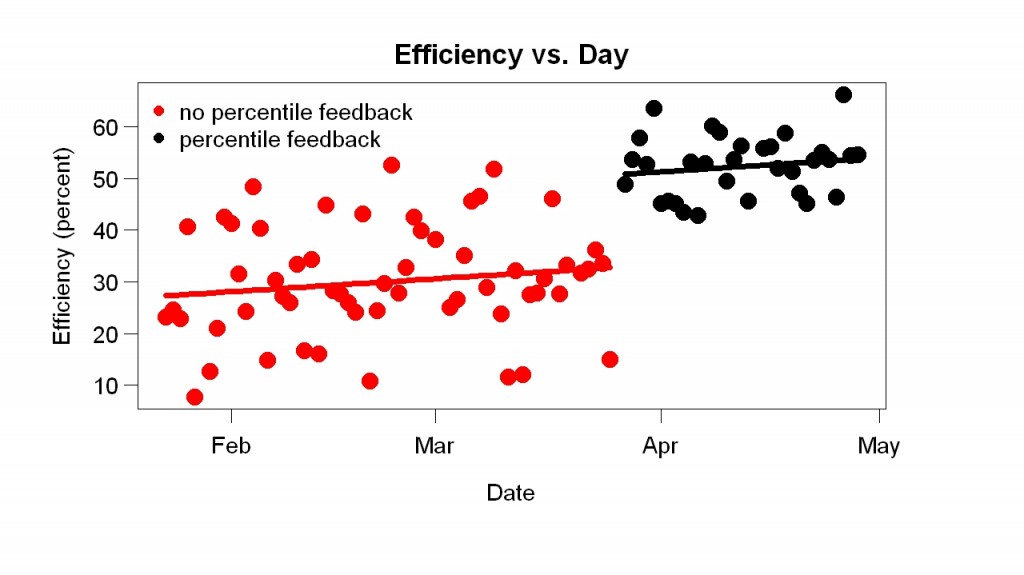
My efficiency jumped up when the display started.

Why did the display help? I call it percentile feedback because that name sums up a big reason I think it helped. The number in the corner makes the percentile explicit but simply seeing where the end of the line falls relative to the points gives an indication of the percentile. I think the graphical display helped for four reasons:

1. All improvement rewarded, no matter how small or from what level. Whenever I worked, the line went up and the percentile score improved. Many feedback schemes reward only a small range of changes of behavior. For example, suppose the feedback scheme is A+, A, A-, etc. If you go from low B- to high B-, your grade won’t change. A score of 100 was nearly impossible, so there was almost always room for improvement.

2. Overall performance judged. I could compare my percentile score to my score earlier in the day (e.g., 1 pm versus 10 am) but the score itself was a comparison to all previous days, in the sense that a score above 50 meant I was doing better than average. Thus there were two sources of reward: (a) doing better than a few hours ago and (b) doing better than previous days.

3. Attractive. I liked looking at the graphs, partly due to graphic design.

4. Likeable. You pay more attention to someone you like than someone you don’t like. The displays were curiously likable. They usually praised me, in the sense that the percentile score was usually well above 50. Except early in morning, they were calm, in the sense that they did not change quickly. If the score was 80 and I took a 2-hour break, the score might go down to 70 — still good. And, as I said earlier, every improvement was noticed and rewarded — and every non-improvement was also gently noted. It was as if the display cared.

Now that I’ve seen how helpful and pleasant feedback can be, I miss similar feedback in other areas of life. When I’m walking/running on my treadmill, I want percentile feedback comparing this workout to previous ones. When I’m studying Chinese, I want some sort of gentle comparison to the past.


10 Years of Weight Measurements: What Was Learned

For ten years Alex Chernavsky has measured and recorded his weight (above). I asked what he learned from this. Here’s what he said:

I started the tracking because I thought that the very act of measuring (and recording) my weight every day would inspire me to lose weight. I don’t think it really worked that way, though. In order to lose weight, I had to take active measures.

What did I learn? I learned that low-carb diets work well in the short-run (as you said), and I also learned that eating low-carb is far, far easier than eating a calorie-restricted diet (which I’ve tried in the past, before I began recording my weight daily). I learned that regular exercise does lead to weight loss, although I can’t rule out a possible confounding factor: I wouldn’t be surprised if it turned out that I changed my eating habits at the same time that I started an exercise regime. That’s probably what Gary Taubes would claim.

I also learned that the Shangr-La diet works well for me. I think that the current upward trend is caused (at least in part) by the fact that I’m eating breakfast more and more often. I didn’t start eating breakfast until sometime last autumn. I will try eliminating breakfast again to see if it reverses the trend. I must say, though, that it’s a little difficult to watch my wife eating some scrumptious morning meal while I just drink coffee. The temptation is hard to resist.

I also learned that my weight fluctuates for no apparent reason at all. If you look at the period of roughly April 20, 2008 through mid-July 2008, you’ll see a drop of about ten pounds. I remember being surprised and puzzled during this time, because I could not think of any plausible reason why this weight loss would occur. I still don’t know. In any case, it was short-lived.

I also learned that I should have kept much better notes about what was going on during those ten years. I’m kicking myself now. I plan on continuing to collect data, and I will try to annotate the data better in the future.

My comments here.

Efficiency Measurement Update

Here is another example of the efficiency graphs I’ve blogged about (here, here and here). The line is the current day; it shows how well I’m doing compared to previous days. It goes up when I work, down during breaks. The number in the right corner (“77″) is the percentile of my current efficiency (at the time the graph is made) compared to measurements within one hour (e.g., a measurement at 2 pm is compared to previous measurements between 1 pm and 3 pm).

The blue points come from before I started the feedback; the green points, afterwards. The red and black points are the final points of a day (that is, at quitting time). That the green points are above the blue points suggests that the graphical feedback helped. Here is a better way of seeing the effect of the feedback.

I didn’t expect this, as I’ve said. It is not “the effect of feedback”; before the graphical feedback, I’d gotten non-graphical feedback. It is a comparison of two kinds of feedback.

Why was the new feedback better? Here’s my best guess. It helped a little that it was pretty (compared to text). It helped a lot that it was in percentile form (today’s score compared to previous scores). This meant the score was almost never bad (from the beginning the percentile was was usually more than 50) and yet could always be detectably improved (e.g., from 68 to 70) with a little effort. I wish I could get such continuous percentile feedback in other areas of life – e.g., while treadmill running. I think feedback works poorly when it is discouraging or unpleasant and when it is too hard to improve. When I taught a freshman seminar at Berkeley, I got feedback (designed by a psychology professor) that was so unpleasant I stopped teaching freshman seminars. Because it came only at the end of the term, it was hard to improve — you’d have to teach the class again to get a better score. Moreover, it compared your score to everyone else’s. I think I was in the lower 50%, which I found really unpleasant. There was no easy way to give feedback about the feedback; maybe it is still in use.

In contrast, I love the feedback shown in the upper graph. Not only does it really help, as the lower graph shows, it leaves me at the end of the day with a feeling of accomplishment.

Personal Science and Lyme Disease

Here is a website devoted to a new way to cure Lyme disease: ingesting large amounts of Vitamin C and salt. The website is vague about who made it but it certainly isn’t a for-profit enterprise. It begins:

After 13 years of suffering with Lyme disease, a possible cure has been stumbled upon. A cumulative effect of much research has produced the possibility that salt and vitamin C may be all that is needed to beat this elusive illness. Without going into a lot of detail, our theory is that Lyme is not just a bacterial disease, but also an infestation of microfilarial worms. . . From experimenting with the treatment of salt and vitamin C, we settled on a dosage of 3 grams of salt and 3,000 mg of vitamin C, each dose taken 4 times per day. . . . The Treatment can be grueling; taking it with food may aid in digestion. The results [= the improvement] should be almost instantaneous.

Unsurprisingly, people a naive person might think would be interested turned out to be not be interested:

We have tried on three occasions to get help [= interest in our findings] through the CDC to no avail. The responses were things such as: thanks, we’ll forward to a lyme researcher; or, we don’t accept contributions or downloads from individuals; or, these pictures are obviously fakes. . . . We tried the university routine. A public health researcher put us onto a microbiology chair, who sent us to a CDC parasitologist, who said he wasn’t a clinician and suggested a pathologist. . . . We tried the most noted lyme sites on the web. We were disappointed that most of them seem more concerned with fundraising than disease.

Which sounds like “we” is one person — a man. In any case, I hope “they” will allow outsiders to contribute experiences, perhaps by adding forums to the site. This is terrific work.

Effect of Graphical Feedback on Productivity: Another Look

A few months ago, inspired by talking to Matthew Cornell, I started tracking when I was working. After a while I added graphical feedback like this:

The graph shows efficiency (time spent working/time available to work) versus time of day. The line shows the current day (not today, the current day when I made this graph). The higher the line, the better. When I work it goes up; when I take a break it goes down. The points are previous days. When the line is higher than the points, I am doing better than previous days. As I said in my first post, this seemed to help a lot: compare the green points (after graphical feedback) to the blue points (before graphical feedback). I blogged about possible explanations.

Here is more analysis. This graph shows efficiency versus day. Each point is the final efficiency (the efficiency after my last bout of work that day) for one day (the black and red points on the previous graph). These results suggest that the graphical feedback caused a sudden improvement, supporting the impression given by the blue/green (before/after) comparison of the earlier graph.

Before graphical feedback, the graph shows, efficiency was slowly increasing. Perhaps that was due to measuring when I was working, but I suspect it was due to the text feedback I got. I often used my tracking system to find out how long my current bout of work had lasted and how much I had worked so far that day. (For example, right now the text feedback is “15 minutes of blog, 73 minutes today”, which means I’ve spent 15 minutes writing this blog and before that worked 58 minutes on something else.)

Let me repeat what I said in another post: This was a big surprise. I collected this data for other reasons, which had nothing to do with graphical feedback. Before this project, I had made many thousands measurements of work time, but they were (a) tied to writing, not all work and (b) recorded inside the program I use for writing (Action Outline). Using R would have been slightly harder — that’s why I used Action Outline. I never studied the data, but I had the impression it helped.

You may know about the brain-damage patient H.M. His brain damage caused loss of long-term memory formation. He could remember something for a few minutes but not longer. The researcher working with him had to keep introducing herself. A pleasant side effect was that he could read the same thing again and again — a magazine article, for example — and enjoy it each time. This is like that. I am stupid enough that the results of my self-experimentation continue to surprise me (which I enjoy). You might think after many surprises I would stop being surprised — I would adjust my expectations — but somehow that doesn’t happen.

My Theory of Human Evolution: New Version

After a casual article, a talk, and many blog posts about my theory of human evolution, I managed to write a book chapter about it. Blogging helped. You may remember the ideas that language began because it increased trade and art began because it increased innovation. However, the center of the theory isn’t language and art, but procrastination. Above all, humans are the animals that specialize and trade. That’s obvious. Not obvious is that specialization begins with repetition — doing something over and over makes you an expert. The tendency to repeat had to be attachable to all sorts of activities, so that our ancient ancestors become expert at a wide range of things and could trade with each other. The mechanism behind this arbitrary repetition made it easy to repeat what you did yesterday and hard to do something new. Nowadays it does the same thing and thereby causes procrastination — difficulty starting something new.

The arbitrary day-after-day repetition began before trade. I believe it began when our ancestors were still hunting and gathering, like chimps. At some point there was a long-lasting surplus of food. The surplus lasted so long that it became beneficial to specialize while foraging. I suspect the great surplus was the discovery and exploitation of seafood, just as Elaine Morgan says, but what caused the abundance doesn’t matter for my theory. Specialization during foraging led to specialization during free time (hobbies). Trade began, part-time jobs (trading your specialty for necessities) began, and, when the pile of knowledge grew big enough, full-time jobs began.

The notion that repetition is behind expertise is supported by the idea that people who are really good at something have practiced a lot — say, 10,000 hours. I am saying two new things here: 1. Repetition is increased by hedonic changes: We want to repeat what we did yesterday. Doing something today makes it more pleasant to do tomorrow. 2. It’s not just superstars, such as the Beatles and Wayne Gretzky (Malcolm Gladwell’s examples), it’s everybody. Arbitrary repetition is behind Adam Smith’s “division of labour”. Our whole economy grew from a tendency to repeat today what you did yesterday.

How to Self-Experiment

At the upcoming QS Conference (May 28-9, San Jose), Robin Barooah and I will run a session about self-experimentation. Alexandra Carmichael asked me to write a post about how to do self-experimentation as a kind of advertisement for the session. Robin and I will be giving examples of what we have done and what we learned from them. Here’s some of what I’ve learned.

1. Easier to learn useful stuff than I expected. In contrast to the rest of life, where things turn out harder than expected, learning useful stuff by self-experimentation was always easier than I expected, in the sense that the benefit/cost ratio was unexpectedly high. I learned useful things I never expected to learn. An example is acne. When I was a grad student I had acne. My dermatologist had prescribed two drugs, tetracycline and benzoyl peroxide. I believed that the tetracycline worked and the benzoyl peroxide did not work. My results showed the opposite. It hadn’t occurred to me that I could be so wrong, nor that my dermatologist could be wrong (he believed both worked), nor that the establishment view (treat acne with tetracycline) could so easily be shown to be wrong.

2. Don’t be afraid of subjective measurements. By subjective measurements I mean non-physical measurements, such as ratings of mood or how rested I felt — what professional researchers call “self-report”. They routinely say self-report is misleading. At first, I wondered if my expectations and hopes would distort the measurements. As far as I can tell, that didn’t happen. Instead, I found such measurements helped me learn plenty of useful stuff I couldn’t have learned without it. For example, I learned how to improve my mood and how to wake up more rested.

3. Complex experimental designs were rarely worth the extra effort. Now and then I tried relatively complex experimental designs (e.g., randomization, a factorial experiment). Usually they were too hard.

4. Run conditions until you get 5-40 days of flat results (flat = what you are measuring is not going up or down). Ideal is 10-20 days. Suppose I want to compare Treatments A and B (e.g., different amounts of butter). I decide to make one measurement/day. The first step would be to do A for several days. I keep doing A until whatever I am measuring (e.g., sleep) stops steadily increasing or decreasing and then run several more days — ideally, 10-20. Then I do B for several days. I keep doing B until my measurement stops changing, then I do 10-20 more days of B. If the B measurements looked different from the A measurements, I would then return to Treatment A. It’s always a good idea to run a treatment until your central measurement stops changing, and then run it longer. How much longer? I’ve found that less than 5 days makes me nervous. Whereas running a condition for more than 40 days of flat results is a wasted opportunity to learn more by trying a different treatment.

5. Data analysis is easy. The most important thing is to plot measurement versus day. It will tell you most of what you want to know. For example, most of the graphs in this paper show whatever I was measuring (sleep, weight, etc.) as a function of day.

6. When you add data, look again at all the data. Each time I collect new data, I plot all of the data, or at least a large chunk of it. This helps spot unexpected changes. For example, each time I measure my weight I look at a plot of my weight over the last year or so. Recently I found that cold showers caused me to gain weight, which I hadn’t expected. If I hadn’t looked at a year of data every time I weighed myself, it would have taken longer to notice this.

7. Don’t adjust your set. My conclusions often contradicted expert opinion. Again and again, however, other data suggested my self-experimental conclusions were correct. Acne is one example. Later research supported my conclusion that tetracycline didn’t work. Another example is breakfast. Experts say breakfast is “the most important meal of the day.” I found it caused me to wake up too early. When I stopped eating it, my sleep got better. Other data supported my conclusion. The Shangri-La Diet is a third example. According to experts, it should never work. Hundreds of stories show it works at least some of time.

The most useful lesson I learned was the most basic. You will be tempted to do something complicated. Don’t. Do the simplest easiest thing that will tell you something. The world was always more complicated than I realized. Eventually it sank in: Complicated (experiment) plus complicated (world) = confusion. Simple (experiment) plus complicated (world) = progress.

Why Did Graphical Feedback Improve My Work Habits?

A few days ago I posted about the effect of efficiency graphs — graphs of time spent working/available time vs time of day (see below for an example). I used these graphs as feedback. They made it easy to see how my current efficiency compared to past days. As soon as I started looking at them (many times/day), my efficiency increased from about 25% to about 40%. I was surprised, you could even say shocked. Sure, I wanted to be more efficient but I had collected the data to test a quite different idea. In this post I will speculate about why the efficiency graphs helped.

Commenting on my post, a reader named Wayne suggested they helped for two reasons:

1. Motivation: You basically turned it into a contest with yourself by phrasing it as “today compared to previous days”. . .

2. Concreteness. . . . You were originally working with data in abstraction: what does “good” or “better” really mean, in realistic terms? . . . [Now] you can focus on the much more concrete: “am I doing better than in the past?”

This is a good guess. Before the graphical feedback, I had gotten plenty of non-graphical feedback: (a) how many minutes worked so far that day and (b) how many minutes during the current bout of work. Naturally I compared these numbers to previous days — certain total minutes per day and certain bout lengths were good, others were bad (e.g., working only 20 minutes before taking a break was bad, working 50 minutes before a break was good) — but I barely corrected for time of day. I vaguely knew that a certain amount by noon was good, for example. In other words, I did compare present to past, but vaguely.

Why were the efficiency graphs better than the text feedback? In addition to Wayne’s suggestions, I can think of other possible reasons:

1. Small improvements rewarded. When I was working, the line went up. Seeing this I thought good! — that is, I was rewarded. A good thing about this scheme is that it rewarded small improvements. A reward system that dispenses plenty of rewards (at the right times) will work better than a system that dispenses few of them.

2. Realistic goals. The goal — doing better than in the past — wasn’t hard to reach because the feedback was based on the whole previous distribution. I felt good if I was doing better than the median and even better the further from the median I was. This is more realistic than, say, dispensing reward only if I do better than ever before.

3. Pretty. The graphs are more attractive than a line of print (“40 minutes worked so far, 120 minutes so far today”) so I looked at them more often. Any feedback mechanism will work better if you pay more attention to it.

4. Loss aversion. Looking at the graphs caused a low-level pressure to work when I wasn’t working because I imagined the line going down. With previous feedback, loss was less obvious. With the previous feedback, if I didn’t work, minutes worked just didn’t increase; it did not go down.

5. Gentle pressure. When I didn’t work, my efficiency score went down slowly because it was based on the whole previous day, not just the last 10 minutes. This made the whole thing more sustainable.

In hope of rewarding even smaller improvements, I added a number to the graph: the percentile of the current efficiency score to efficiency scores near the same time of day. Here is an example.

2011-04-04 more feedback

Each point is the start or end of a bout of work. Blue points = before graphical feedback, green points afterwards. The red and black points are the final points of the days. The brown line is the current day.

The large 77 in the upper right corner means 77th percentile, which means that the current efficiency score (shown by the end of the brown line) is in the 77th percentile compared to efficiencies measured within an hour of the same time of day. Let’s say the time was 9 pm. Then this percentile was computed using all scores (all the dots) between 8 and 10 pm. 77th percentile means that about 23% of the surrounding scores were higher, 77% lower.

The reason for this change is to make the feedback even more graded and realistic — even more sensitive to small improvements that are possible to make. My theory of human evolution says that art and decoration evolved because tools did a poor job of rewarding improvement. Until you could make the most primitive example of a tool, there was no reward for increased knowledge. The reward-vs.-knowledge function was close to a step function. Desire for art and decoration provided a more gradual reward-vs.-knowledge function. (I just finished a new write-up of that theory, which I will post soon.) . That’s what I am trying to do here.

Dangers of Antibiotics: Case Study

A column in The Telegraph by a doctor named James Le Fanu describes the following case:

It started eight years ago when he was laid low, while on holiday in Sri Lanka, by diarrhea. His symptoms cleared with antibiotics but he was left with a churning gut and frequent loud belching. This carried on for a couple of years until, listening to Farming Today, he heard an Australian vet talking about his belching sheep. “I got in touch and explained that I seemed to be behaving like one of his flock,” he writes. The vet suggested his bowel infection might have interfered with the gut enzymes for metabolising sugars, causing him to be intolerant of fructose. A test dose of orange juice immediately brought on his symptoms, and his gut problems settled on reducing his sugar intake.

In other words, no one consulted about this case, including the Australian vet and Dr. Le Fanu, seems to have understood that (a) a large fraction of our digestion is done by bacteria and (b) antibiotics kill bacteria. If you take antibiotics you risk digestive problems. I predict the belching would have gone away had he started eating fermented foods with bacteria that digest sugar. It was certainly worth a try.