Crazy-Spicing 3.0: Fava Bean Crostini

Here is another way — in addition to ELOO, refined walnut oil, other flavorless oils, sugar water, nose-clipped smoothies, crazy-spiced smoothies, and nose-clipped food in general — to get “SLD calories” — by which I mean food that raises your set point much less than usual. I love this dish.

How to make crazy-spiced fava bean crostini:

1. Soak dried fava beans for 12-24 hours. I make about 1 pound at a time. One pound of beans makes about 6 servings.

2. Skin the beans. I make a small tear along the rim of the bean and then push the inside out. Takes a few seconds per bean. Discard the skins.

3. Cook the beans. I put them in a crockpot on high for 3 hours covered in water but any cooking method is okay.

4. Mash the beans, adding finely chopped onion and your favorite oil. I usually use flaxseed oil. The onion is for texture. At this point I have several meals worth. I store it in the refrigerator.

5. Slice a ciabatta-like bread into long thin pieces. Toast.

6. Add random spices to the beans. I use 4 or 5 Penzey’s spice blends. If the beans have been refrigerated I warm them in the microwave before this step.

7. Spread the bean mixture on the toast.

8. Add an interesting topping, which can be almost anything. I have used tomatoes, cooked mushrooms, and chopped arugula.

Background.
Crazy spicing means adding randomly-chosen spices (say, 10-20) to your food so that the flavor is unrecognizable. The theory behind the Shangri-La Diet predicts that this will cause weight loss. No flavor recognition = no set point increase = lower set point = weight loss. The closest thing to a test of this prediction — making the flavor of food less recognizable will cause weight loss — was an experiment done by Alan Hirsch, a Chicago neurologist. A few hundred people sprinkled flavor crystals on all of their food for six months — one flavor for savory foods, another for sweet. The flavor crystals changed once a month. The subjects lost a substantial amount of weight.

The problem with adding random spices to ordinary food is the feeling of loss — “Alas, my beloved X.” Crazy Spicing 2.0 — crazy-spiced smoothies — solved this problem by putting the spices in a homemade smoothie, which does not have an expected taste (so no feeling of loss) and can also be made to taste good in ways that do not involve flavor recognition (sweet, salty, creamy, cooling, and thirst-quenching). Smoothies, however, do not look like ordinary food nor are they crunchy and chewy — something I’ve noticed I especially want now that I eat less. The fava bean crostini look fine — I had something similar at Chez Panisse — and have a great texture. They are wonderfully crunchy and chewy. Toppings can make the texture even better.

Notes. 1. I have tried less expensive, less glamorous beans just once; the texture was less appealing. It is not far from hummus (garbanzo bean paste), however. I have not tried garbanzo beans. 2. Add the spices once per meal. Each meal a new set of spices, in other words. If you add the spices just once and then eat the result many times, it becomes a ditto food. 3. Beans have a low glycemic index, another good feature of this dish. 4. To make it more nutritious, you can add protein powder or almost anything else you would add to a smoothie. It already has lots of fiber. 5. This is something I make far in advance. Make it on Sunday, eat for the rest of the week, for example. The only lengthy step — skinning the beans — I actually enjoy. 6. Why do I love this dish? Because of the full-bodied crunchiness and chewiness. Because it looks as good as restaurant food. Because the toppings allow room for creativity. Because once I have made a batch, it takes just a few minutes to make a meal’s worth (toasting the bread is the most time-consuming part). Because I’ve always liked fava beans.

Grass-Fed Beef, the Shangri-La Diet, and the Future of Food

A recent Slate article compared beef from different sources. “We sampled rib-eye steaks from the best suppliers I could find. The meat was judged on flavor, juiciness, and tenderness and then assigned an overall preference.”

The winner: grass-fed beef, which was also the least expensive ($22/pound). The highly-convincing tasting notes:

Never have I witnessed a piece of meat so move grown men (and women). Every taster but one instantly proclaimed the grass-fed steak the winner, commending it for its “beautiful,” “fabu,” and “extra juicy” flavor (that “bursts out on every bite.” The lone holdout, who preferred the Niman Ranch steak, agreed that this steak tasted the best, but found it a tad chewy.

The grass-fed beef was probably the highest in omega-3, by the way. What the writer found wrong with grass-fed beef was lack of consistency:

One grass-fed rancher I spoke to refused to send me any steak for this article because, he said, it sometimes tastes like salmon. Restaurants and supermarkets don’t like grass-fed beef because like all slow food, grass-fed beef producers can’t guarantee consistency-it won’t look and taste exactly the same every time you buy it.

From the standpoint of the Shangri-La Diet, of course, variable flavor is a plus — a big one. I expect a similar result with other foods — the more variable foods taste better. As any engineer knows, the less you have to worry about keeping a variable (such as flavor) constant, the more you can do to maximize it.

Thanks to Clyde Adams for the link.

More Evidence That Fat Is Not Bad For You

In the most recent issue of American Journal of Epidemiology (15 November 2006) is an article about whether there is a connection between dietary fat and breast cancer. They found no connection. Part of the abstract:

Dietary fat in midlife has not been associated with breast cancer risk in most studies, but few have followed women beyond one decade. The authors examined the relation of dietary fat, assessed by repeated questionnaires, to incidence of postmenopausal breast cancer in a cohort of 80,375 US women (3,537 new cases) prospectively followed for 20 years between 1980 and 2000. The multivariable relative risk for an increment of 5% of energy from total dietary fat intake was 0.98 (95% confidence interval: 0.95, 1.00). Additionally, specific types of fat were not associated with an increased risk of breast cancer.

Reference: Dietary Fat and Risk of Postmenopausal Breast Cancer in a 20-year Follow-up. Esther H. J. Kim, Walter C. Willett, Graham A. Colditz, Susan E. Hankinson, Meir J. Stampfer, David J. Hunter, Bernard Rosner, and Michelle D. Holmes. Am. J. Epidemiol. 2006 164: 990-997.

How Well Does the Shangri-La Diet Work? (part 2)

The Post Your Tracking Data Here section of the SLD forums now contains lots of data. In addition to the weight-vs.time graphs on the home page and in the forums, I have now analyzed this data in other ways. The graphs below (based on data up to November 2) show how the rate of weight loss varies with (a) time on the diet and (b) weight.

For each person reporting weights, I computed a rate of weight loss for every interval in their data. For example, if someone reported her weight at three different times, then there are two intervals: from Time 1 to Time 2, and from Time 2 to Time 3. For each interval I computed a rate of weight change. The scatterplots below are based on 820 intervals. Each point is a different interval.

The first graph shows how the rate of weight change varied with how long you have been doing the diet.

This shows that average weight loss slowed down from about 2.2 pounds/week to about 1 pound/week during the first few weeks and didn’t change much after that.

Another obvious factor that might affect weight-loss rate is weight: Perhaps people who weigh more lose faster. Because rate of weight loss changes during the first few weeks, I looked at this question two ways: using only data for Week 1 on the diet (early loss); and using only data after 4 weeks on the diet (later loss).


The top graph (early loss) shows that during Week 1, your weight has a big effect on your rate of weight loss. People who weigh more lose faster. The bottom graph (later loss) shows that after 4 weeks, your weight has much less effect on how fast you lose.

My explanation: During the first week or so of SLD, most of the weight loss is not fat or water but the food in your digestive system. Because the diet has reduced your appetite, you are eating less each day. But the speed (inches/day) at which food travels through your digestive system does not change; so relatively full digestive system is slowly replaced by a relatively empty one. After this replacement — which takes about one week — is complete, further weight loss is all due to loss of fat. You comfortably lose fat at the rate at which your set point goes down. The long-term rate of weight loss is about 1 pound/week because the set point is going down about 1 pound/week.

Data analyses like these have never been published for any weight-loss method. Not that they’re sophisticated or clever or surprising — they’re not. Given (a) the amount of damage caused by obesity and (b) the amount of money spent on health research (2006 NIH budget: $28 billion), it’s quite a gap. Possibly related to the misguidedness I discussed last week.

Amazon Rank: The Poor Man’s BookScan

Calling all authors!

If you have written a book, you have probably wondered: What’s the connection between amazon rank and number of books sold? Well, wonder no more. Below is a graph based on The Shangri-La Diet. The copies-sold information is from Nielsen BookScan. Their website says:

Most of the nation’s major retailers for books are included in our panel of reporting book outlets: Borders and Walden, Barnes & Noble Inc., Barnes & Noble.com, Deseret Book Company, Hastings, Books-A-Million, Tower Music and Books, Follett College stores, Buy.com and Amazon.com. Weekly sales information is also tracked from Mass merchandisers like Target, Kmart and Costco, along with smaller retail chains and hundreds of general independent bookstores.

The graph shows that the relationship between books sold and amazon rank is linear on a log-log scale (as so many things are — the physicist Per Bak wrote a whole book about such relationships). Each point is a different week. To illustrate the formula of the line,

ln(copies sold/week) = 9.67-0.53*ln(amazon rank),

the amazon rank of Send In The Idiots: Stories From the Other Side of Autism by Kamran Nazeer, a masterpiece about the adult lives of autistic children, is now 35,758. Predicted sales is 61 books/week.

The Trouble With Rigor

This is an easy question: When writing down numbers, when is it bad to be precise? Answer: When you exceed the precision to which the numbers were measured. If a number was measured with a standard error of 5 (say), don’t record it as 150.323.

But this, apparently, is a hard question: When planning an experiment, when it is bad to be rigorous? Answer: When the effort involved is better used elsewhere. I recently came across the following description of a weekend conference for obesity researchers (December 2006, funded by National Institute of Diabetes & Digestive & Kidney Diseases):

Obesity is a serious condition that is associated with and believed to cause much morbidity, reduced quality of life, and decreased longevity. . . . Currently available treatments are only modestly efficacious and rigorously evaluating new (and in some cases existing) treatments for obesity are clearly in order. Conducting such evaluations to the highest standards and so that they are maximally informative requires an understanding of best methods for the conduct of randomized clinical trials in general and how they can be tailored to the specific needs of obesity research in particular. . . . We will offer a two-day meeting in which leading obesity researchers and methodologists convene to discuss best practices for randomized clinical trials in obesity.

Rigorously evaluating new treatments”? How about evaluating them at all? Evaluation of new treatments (such as new diets) is already so difficult that it almost never occurs; here is a conference about how to make such evaluations more difficult.

This mistake happens in other areas, too, of course. Two research psychiatrists have complained that misguided requirements for rigor have had a very bad effect on finding new treatments for bipolar disorder.

More Reason to Crazy-Spice

Spices are good for you, I blogged, because they are high in antioxidants. A new study, done in Singapore with elderly subjects, supports this conclusion. It found that curry-eaters do better than others on a mental test. The abstract:

Curcumin, from the curry spice turmeric, has been shown to possess potent antioxidant and antiinflammatory properties and to reduce ß-amyloid and plaque burden in experimental studies, but epidemiologic evidence is lacking. The authors investigated the association between usual curry consumption level and cognitive function in elderly Asians. In a population-based cohort (n = 1,010) of nondemented elderly Asian subjects aged 60-93 years in 2003, the authors compared Mini-Mental State Examination (MMSE) scores for three categories of regular curry consumption, taking into account known sociodemographic, health, and behavioral correlates of MMSE performance. Those who consumed curry “occasionally” and “often or very often” had significantly better MMSE scores than did subjects who “never or rarely” consumed curry. The authors reported tentative evidence of better cognitive performance from curry consumption in nondemented elderly Asians, which should be confirmed in future studies.

Tze-Pin Ng, Peak-Chiang Chiam, Theresa Lee, Hong-Choon Chua, Leslie Lim and Ee-Heok Kua. Curry Consumption and Cognitive Function in the Elderly. American Journal of Epidemiology 2006 164(9):898-906

How Well Does the Shangri-La Diet Work? (part 1: breakdown by starting weight)

The most basic question about the Shangri-La Diet is how well it works. As the host of The Amazing Race might say, there are many ways to answer this question, each with their own pros and cons. Thanks to Rey Arbolay, we can answer this question in a new way: by looking at the data in the Post Your Tracking Data Here section of the Shangri-La Diet forums, where more than 80 people have posted.

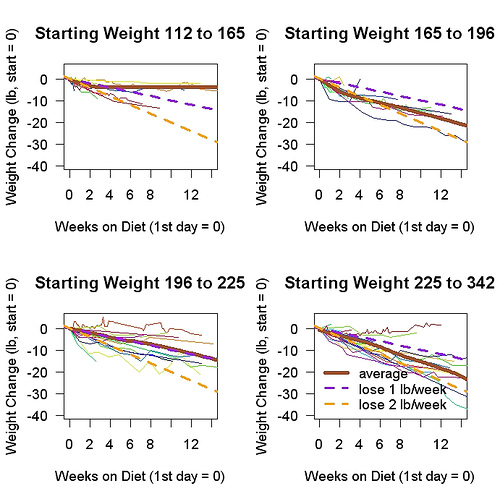
The goal of SLD, of course, is weight loss. The problem with just plotting pounds lost as a function of time on SLD is that a loss of 10 pounds is quite different to someone who starts at 120 pounds and someone who starts at 300 pounds. To deal with this I have divided the results by starting weight. In the graphs below, the ranges of weights were chosen so that there would be roughly the same number of people in each graph.

Starting weight makes a big difference — at least, between the two extremes. Many of the people who aren’t losing very fast are in the lowest quartile. There are still a few outliers — people at the higher starting weights who are losing slowly if at all — but not many.

The next step is to do an analysis that estimates the effect of starting weight and somehow removes it. It might be better to divide people by BMI rather than starting weight, and maybe the y axis can be improved.

Brain Food (part 6: a little more progress)

I did two balance experiments with a warmup of 8 trials. In one, the order of feet (which foot I stood on) was left, then right; in the other, right, then left. In both experiments I did much better (i.e., balanced longer) on my right foot than my left foot, p s < 0.001. This surprised me; I had never heard of such an asymmetry. The difference was so large that the platform size (0.75 inch) good for the left foot was too easy for the right foot.

To make things as simple and easy as possible I decided to stop testing both feet and to only measure balancing on my right foot (and to use a 0.5-inch platform to make it more difficult and avoid a ceiling effect). I tested my balance (a) in silence and (b) listening to a book. The results were similar so I decided the standard condition will be listening to something. I want to make my balance test fast and pleasant.
I came across several promising related facts:

1. On the Shangri-La Diet (SLD) forums, spacehoppa said she felt “solid on [her] feet” — which may mean her balance has improved. If so, the improved balance that I noticed may be widely true. She also said “my mind feels clearer,” another effect I noticed from omega-3’s, and more reason to think omega-3 improve brain function.

2. On the SLD forums, porkypine wrote, “I have a very strong reaction to the 1500 mg of OmegaBrite that I have begun taking in the morning. . . . During the day, I am not just happier, but actually chipper, which is not a normal state for me. I have wondered if I am getting too much Omega-3.” This supports one of the assumptions behind my upcoming tests of the effects of omega-3 on balance: the effects of omega-3 on the brain happen quickly. It also highlights an advantage of measuring balance rather than something else, such as mood — namely, it is reasonable to assume that the better your balance, the better your brain is working. As this quote shows, the mapping between mood and goodness of functioning is not so clear.

3. In a book about neurology (Defending the Cavewoman by Harold Klawans), including Creutzfeldt-Jacob disease, I read: “A [Fore] woman in late pregnancy who was unable to walk easily across a narrow tree trunk bridging a gorge knew from that change in her balance that she had kuru and that she would die of it. The physicians examined her and thought she was normal, but in less than one year, she was dead.” This shows that balance is an especially sensitive measure of brain function, at least under demanding conditions. It’s relatively easy to notice worse balance.

Balance is also much easier to quantify than many other measures of brain function, such as mental clarity.

Brain Food (part 5: a little progress)

I’ve been doing small experiments on my balance to learn what affects it. Most research using new tools follows a progression. Step 1: you learn what people already knew. Step 2: you find new information that isn’t very interesting. Step 3: you find interesting new information. Earlier I found that I could balance on one foot longer on a wider platform — Step 1.

Now Step 2. I’ve done a few experiments comparing different footwear (sandals, shoes, barefoot). In each experiment I ran several conditions, each consisting of 12 trials standing on my left foot followed by 12 trials standing on my right foot. These trials had gaps of seconds between them. Different conditions (different footwear) were separated by at least 10 minutes and usually more.

The right-foot average was always more than the left-foot average. You can see examples of this in my earlier results. I doubt that the right foot/leg is actually better than the left so this suggests there is a substantial warmup effect, as there is in most tasks.

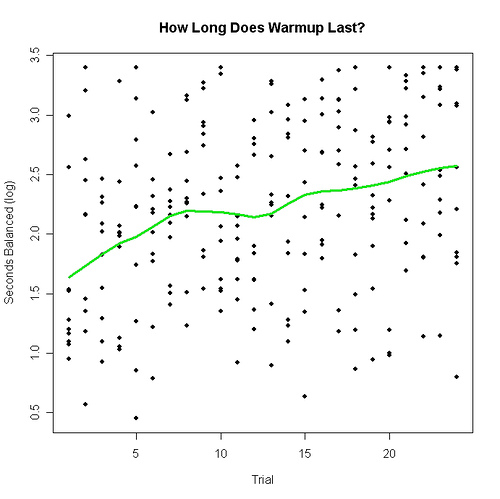
To make measurements more precise, it would help to have a warmup period before collecting the main, more stable data. How long should it be? The graph below shows data from many of the conditions I have run arranged by trial number, with a lowess summary line.

The y axis is in log seconds, not seconds; I used a log transform to make the distribution of the data more symmetrical. The maximum time was 30 seconds. (Log(30) = 3.4.) If I kept my balance for 30 seconds, I stopped, and recorded the result as 30 seconds.

The graph shows an early warmup period that lasts 6-8 trials long, followed by a slow improvement that lasts at least 24 trials. Here is something new and not very interesting: details about the warmup effect.